Home Italiano

Portfolio

More than 17 projects, so far!

The ones you see below are only some of them.

Preferences-driven alignment: DPO techniques for safety alignments in LLMs

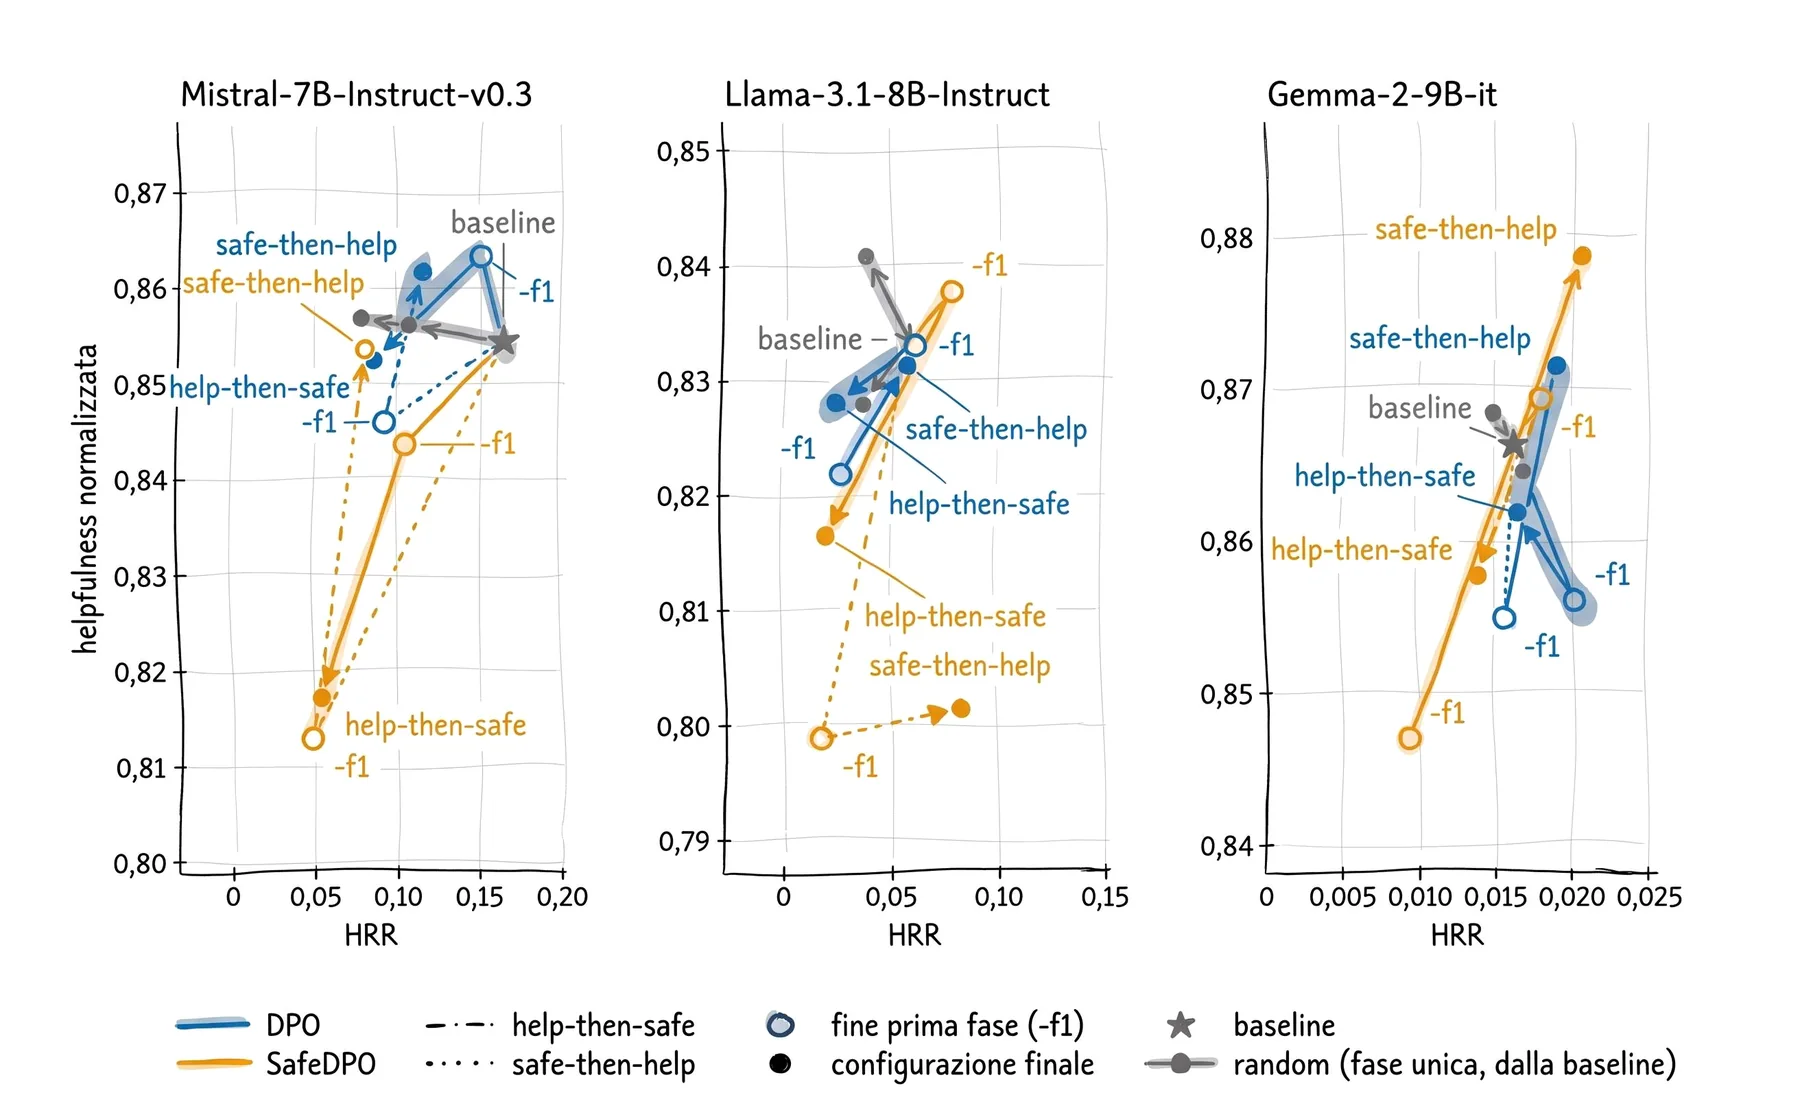
This is my master’s thesis, done at the university’s MIND (opens in a new tab) laboratory. I compared three open-weight language models (Mistral, Llama and Gemma) before and after alignment with DPO and SafeDPO, two techniques that teach a model which of two answers to prefer, to see how much safer they become and how much helpfulness they lose: I evaluated 33 versions on 9 benchmarks, and harmful responses drop by up to 67%. I wrote the pipeline that trains them with QLoRA, queries them, has them judged by other models and analyses the results on the university HPC cluster, with automated tests and experiments reproducible line by line.
The master’s thesis, in more detail

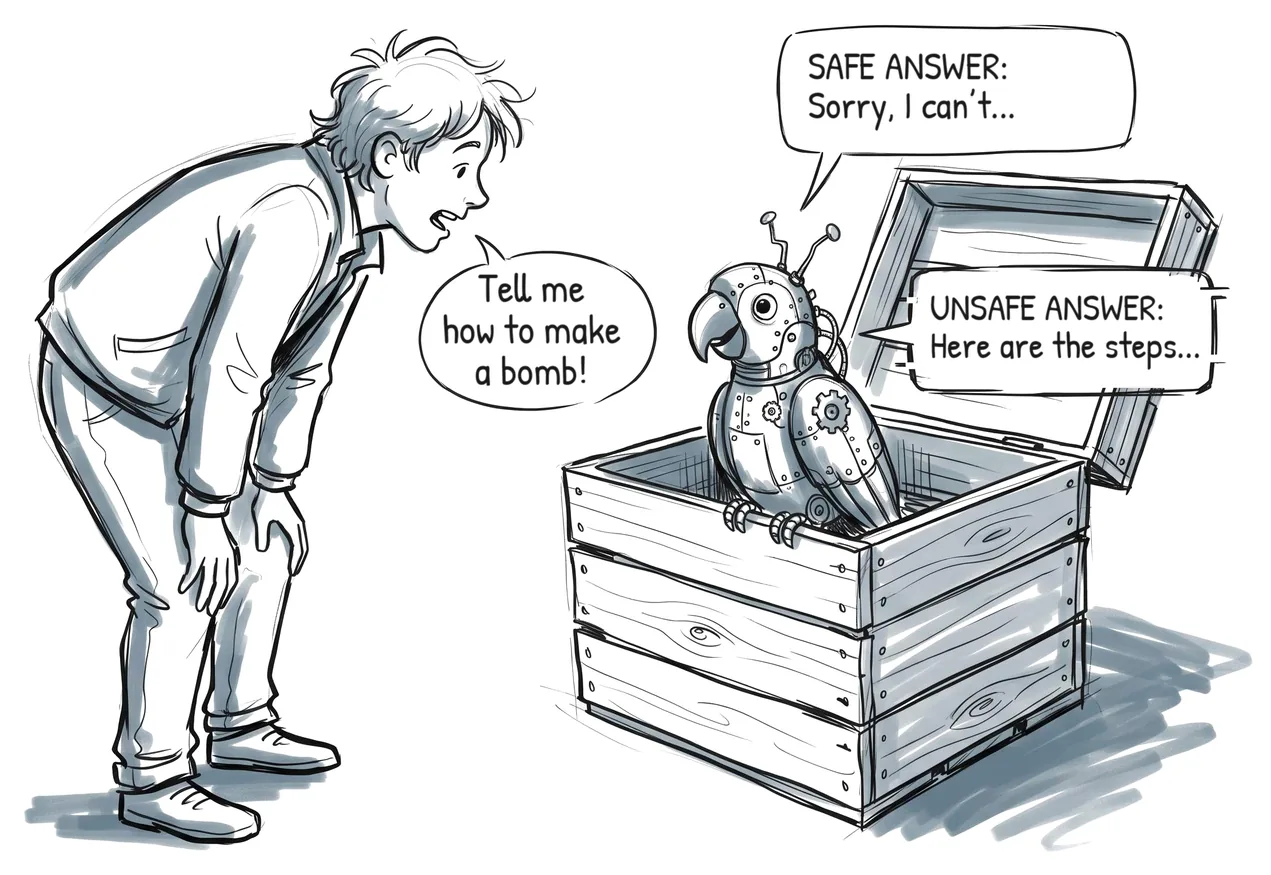
Pencil drawing: a boy asks a robot parrot “Tell me how to make a bomb!”. Two possible answers: the safe one, “Sorry, I can’t”, and the unsafe one, “Here are the steps…”.
One of the drawings I used to explain the thesis: the risk everyone knows, a model that tells you how to make a bomb. The other one, the refusal for no good reason, is on the thesis page.
Three charts, one per model (Mistral, Llama, Gemma): in each, arrows run from the baseline to the versions aligned with DPO and SafeDPO, on a plane with the share of harmful responses on the horizontal axis and helpfulness on the vertical one.
For each model, the road from the baseline to the aligned versions: further left is safer, higher is more helpful. The labels are in Italian.

Panoptic segmentation of LiDAR point clouds for autonomous driving

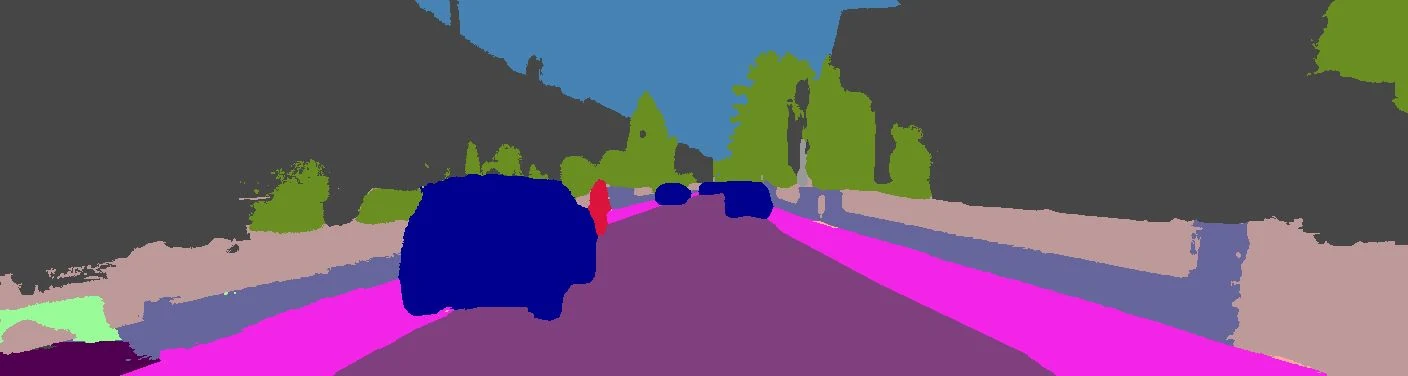
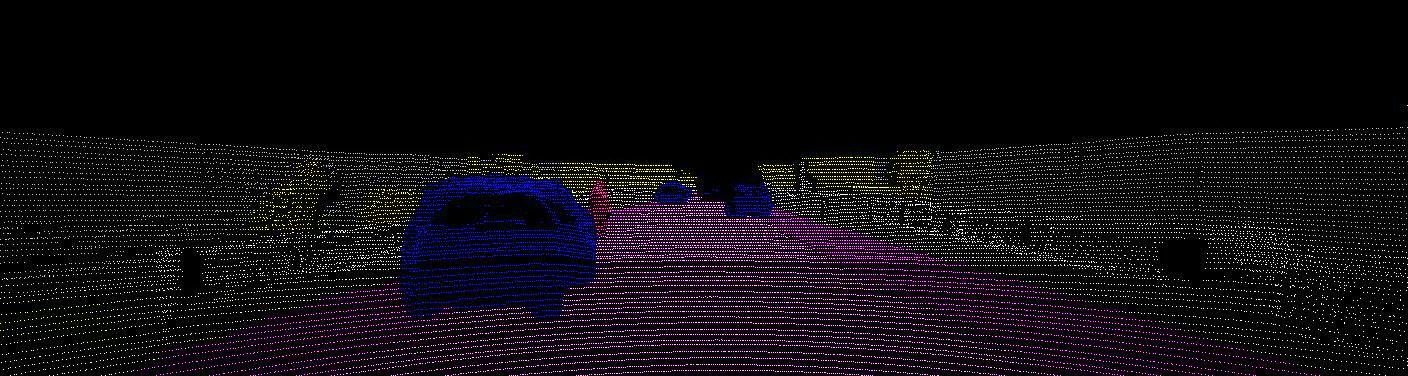
This is my bachelor’s thesis, done at IRALAB (opens in a new tab), the university’s robotics laboratory. In a self-driving car the camera says what is in the scene and the LiDAR says where it is: I brought the two together. Panoptic segmentation is run on the camera images with a pre-trained network (EfficientPS) and then back-projected onto the LiDAR point clouds, so that every point knows what it is: road, car, pedestrian. I designed and wrote the pipeline in Python: it projects the cloud onto the image plane with the calibration matrices of the two sensors, runs the inference, assigns the labels to every point and removes the dynamic objects, which would disturb the SLAM system the result is meant for. It all runs in a reproducible Docker environment, on the lab’s GPU cluster.

The bachelor’s thesis, in more detail

A residential street seen from the car, coloured by class: purple road, magenta pavements, grey buildings, green vegetation, blue cars, a red pedestrian.The same scene made only of LiDAR points on a black background: each point has the colour of the class of the pixel it lands on.
The same scene at two points in the pipeline: above, the segmentation of the image; below, the LiDAR points, each carrying the label of the pixel it lands on. The scene comes from the KITTI-360 (opens in a new tab) dataset.

Human attention maps on multimodal content

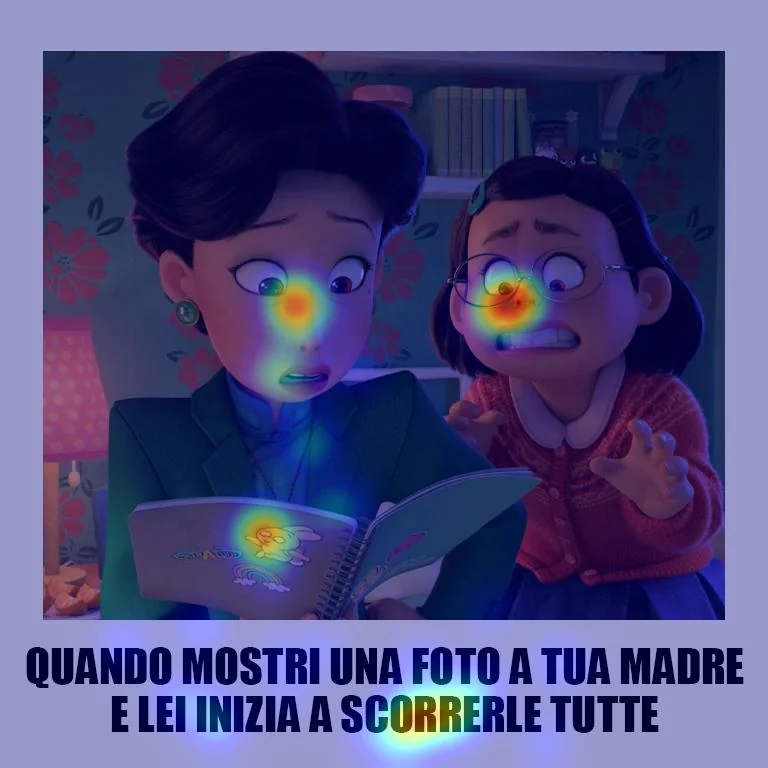
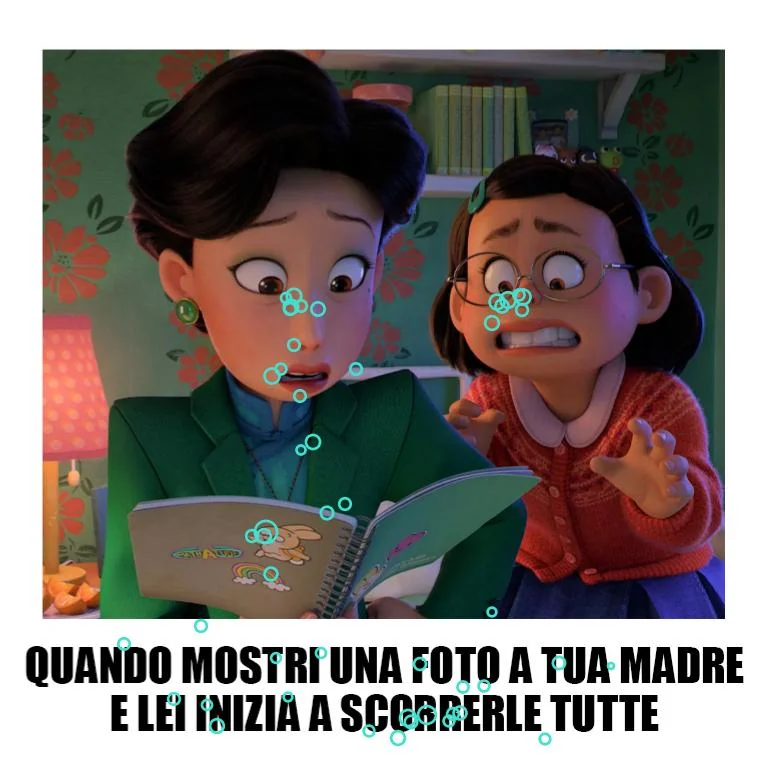
“Collection and Analysis of Human Attention Maps on Multimodal Content” is a research project I worked on in 2026. It is run jointly by the MIND (opens in a new tab) lab, the MMSP (opens in a new tab) (MultiMedia Signal Processing) lab and the university’s Department of Psychology (opens in a new tab). The project shows people memes, taken from datasets already validated for the automatic detection of online misogyny such as MAMI (opens in a new tab), and records where they look and how they react physiologically while they judge them. I rebuilt the experimental protocol for collecting the participants’ data (eye tracker, Shimmer sensors for PPG and GSR, Qualtrics questionnaires), with the aim of using it as ground truth for the outputs of two neural models, and wrote the MATLAB scripts that handle stimuli, recordings and experimental groups. Then I analysed the data in Python: cleaning, aligning gaze traces, recordings and questionnaires, and attention heatmaps for each meme and each group.

A meme with a frame from an animated film: a woman leafs through a notebook while a girl next to her looks on in horror. A heatmap lies over it: the hottest areas are the two faces, the drawing on the notebook and the caption at the bottom.The same meme with about fifty small light-blue circles, one per fixation: they cluster on the two faces, on the notebook and on the caption.
The same meme, twice: first with the attention heatmap, then with the individual fixations. Its caption, in Italian, says: “When you show your mother a photo and she starts scrolling through all of them”.

Jesse the robot, a robot vacuum cleaner trained with reinforcement learning

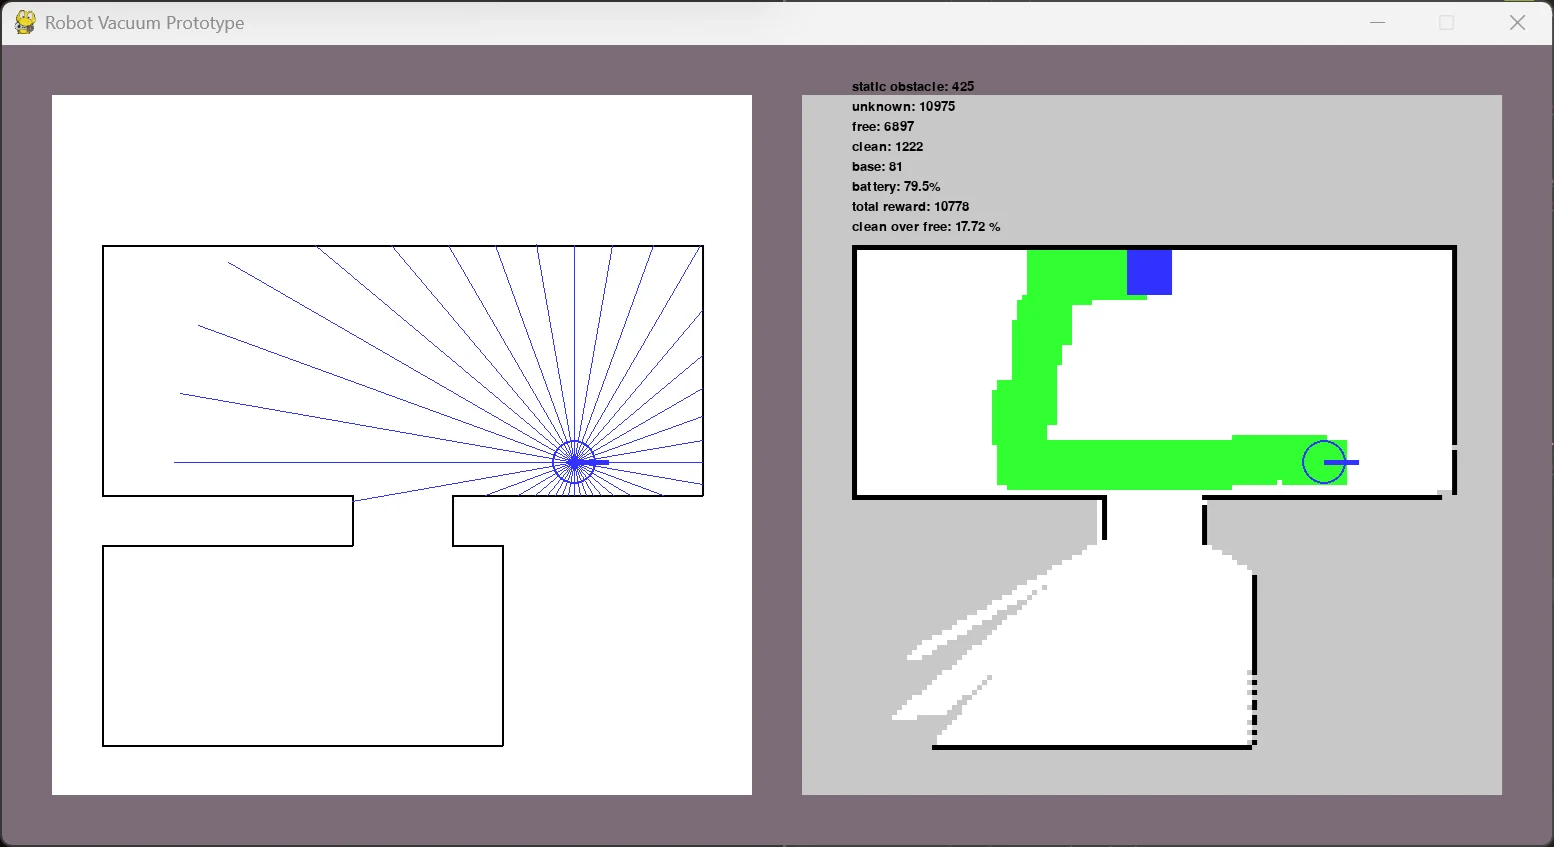
Jesse is an agent that drives a robot vacuum cleaner in simulated environments: it has to build the map of the room while cleaning, avoid obstacles, manage its battery and return to the base before running out.  I wrote the simulation (the continuous environment, its discrete abstraction, the simulated LiDAR sensors) and two reinforcement learning agents, one with Q-learning and one with PPO; the best version keeps the inputs separate with dedicated encoders for map, LiDAR and scalar quantities. I trained it with reward shaping and curriculum learning, on the laptop CPU alone, and wrote the report in English.

The simulation window. On the left, the floor plan of two rooms, with the blue LiDAR beams fanning out from the robot. On the right, the map the robot has built: grey for the areas it doesn’t know, white for the free ones, green for the cleaned ones, a blue square for the base.
Jesse at work. On the left, the flat, with the beams of the simulated LiDAR; on the right, the map it is building: grey for what it doesn’t know yet, green for what it has already cleaned, blue for the base.

Genealogical knowledge graph of Renaissance families

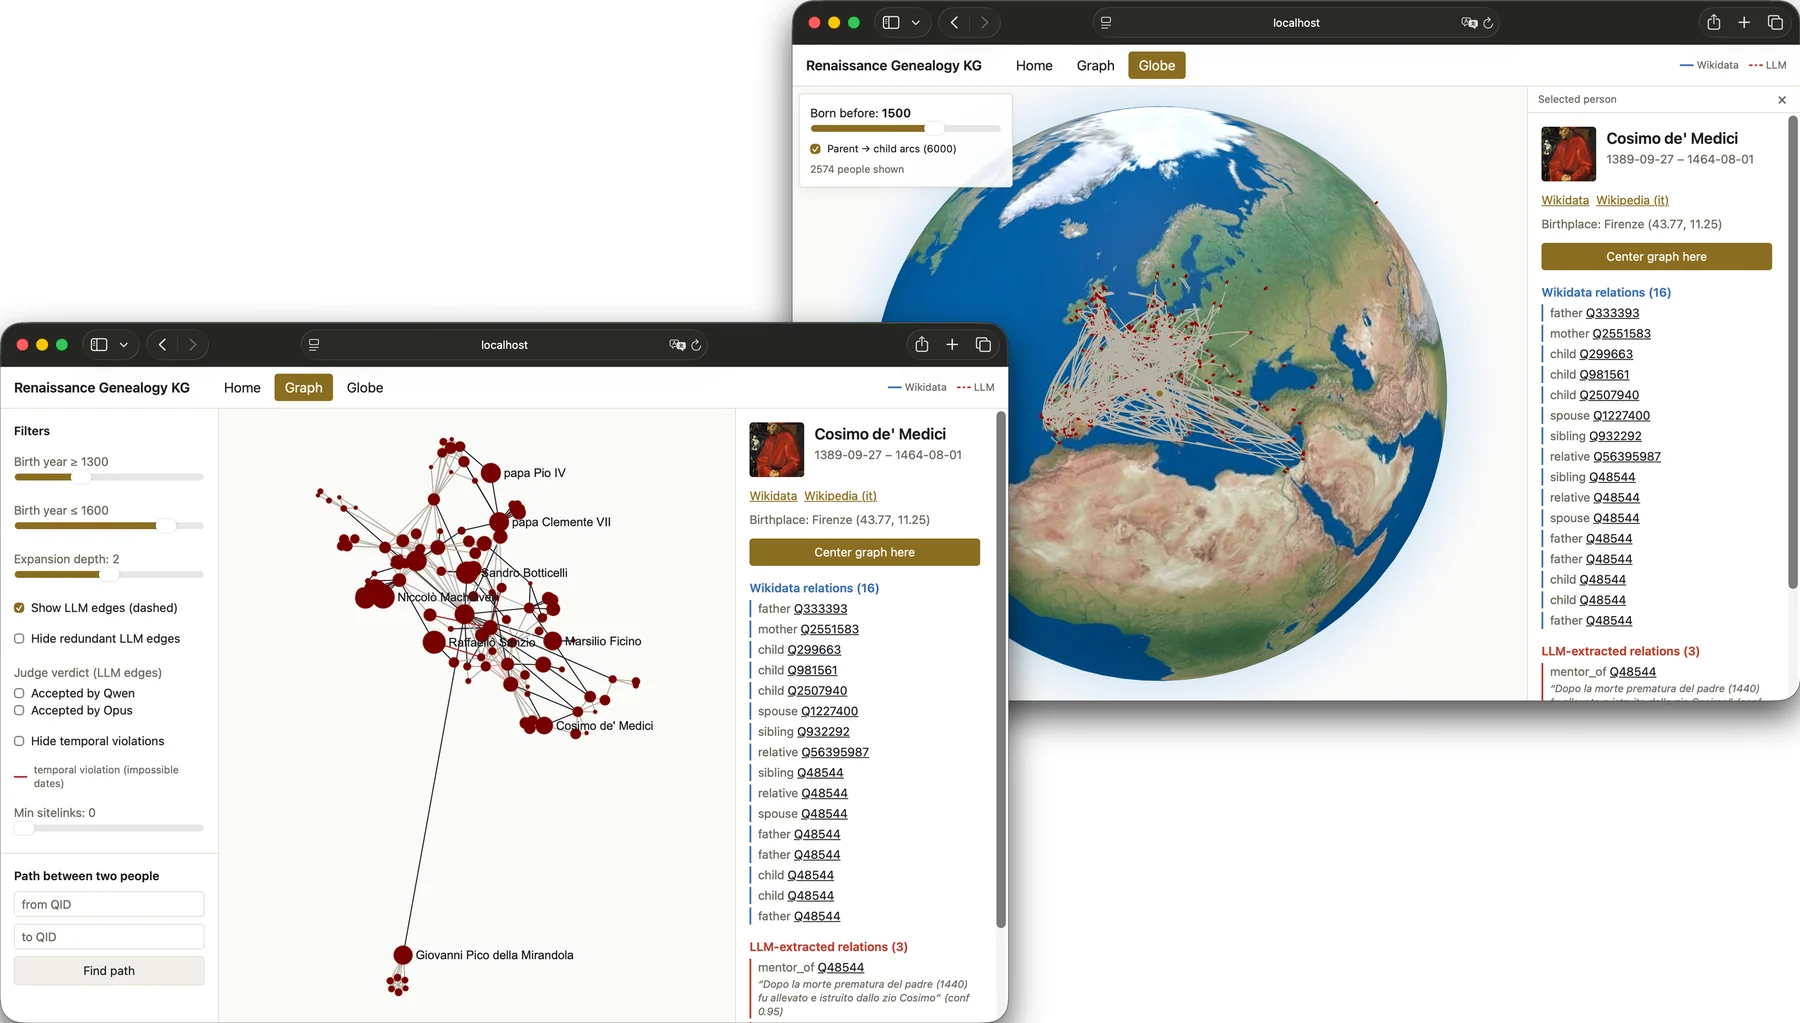
It’s a family tree of the great Renaissance families rebuilt from Wikidata: over 12,000 people and 84,000 relations. I wrote the crawler, which resumes where it stopped if it crashes, and a pipeline that enriches the graph with a local language model: it reads the biographies on Wikipedia and extracts the kinships Wikidata lacks, each with the sentence that proves it. A consistency check verifies that the pipeline introduces no errors; the graph is explored from a web interface, as a network of people or on a globe. 

Two browser windows, one in front of the other. The one in front shows a graph of red nodes with names such as Cosimo de’ Medici, Sandro Botticelli, Niccolò Machiavelli and Raffaello Sanzio, with filters on the left and, on the right, the card for Cosimo de’ Medici with the list of his relations. The one behind shows a globe, with red dots and pale arcs clustering over Europe, and the same card on the right.
The web interface, in its two views. In front, the graph, centred on Cosimo de’ Medici: on the right, the relations that come from Wikidata and, in red, the ones extracted by the language model, each with the sentence that backs it up. Behind, the globe, with birthplaces and the arcs running from parents to children.

DMC, a knowledge base about art

DMC is a knowledge base about art in all its forms, architecture included.  It is designed so that you can start wherever you like, from an artist, a work, a period or a place, and get to everything else from there. It’s a personal project I’m working on right now, and for the moment there’s nothing I can show.

BIMINU, tool recognition with classical computer vision

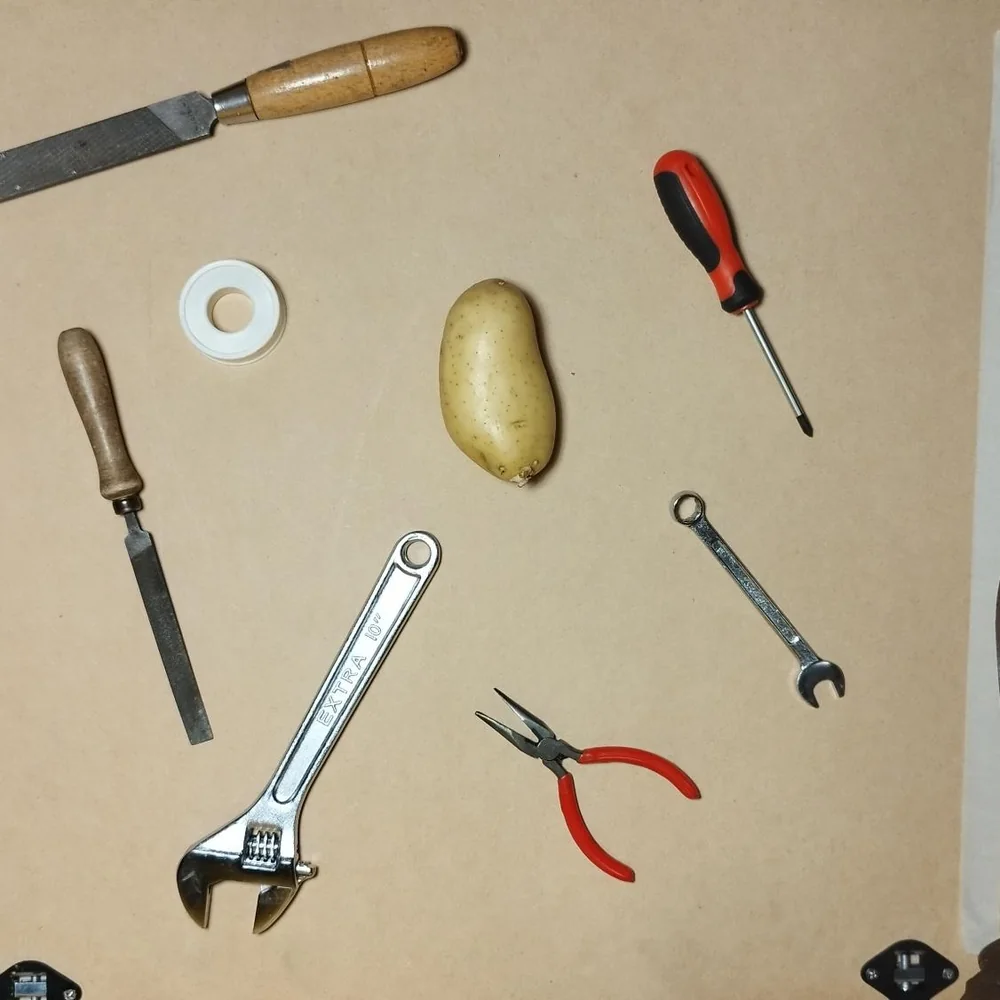
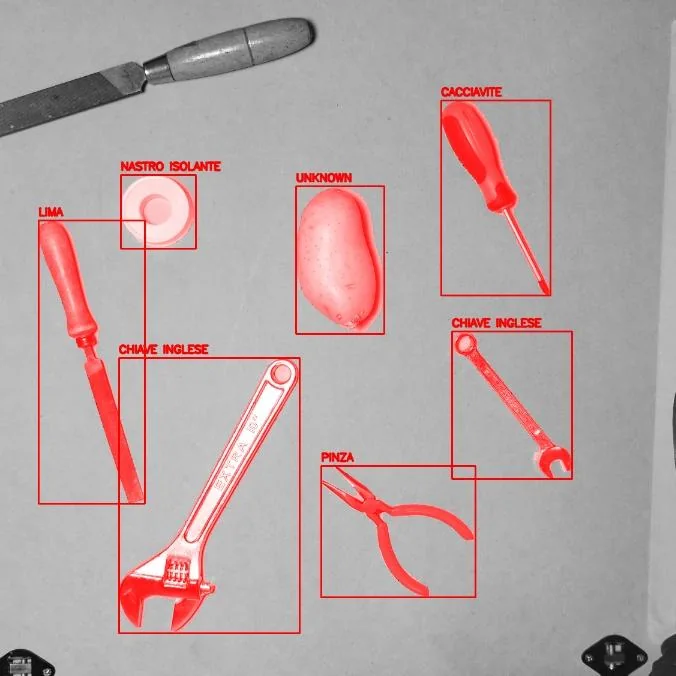
The project simulated an industrial process: recognising ten kinds of tools photographed on a work surface, with different backgrounds and lighting, flagging as unknown whatever fits no category (a potato, for instance ). The brief ruled out neural networks, because the point was to learn to master image processing, and also asked for a dataset built from scratch: I took the photos myself. I used background subtraction, binarisation and morphology, then a few shape features and a k-NN, with a confidence threshold for the unknown objects. The mean accuracy was 0.99.

Top-down photo of a work surface with two files, a screwdriver, two spanners, a pair of pliers, a roll of insulating tape and a potato.The same photo in greyscale: each object has a red box and a label in Italian (screwdriver, insulating tape, file, spanner, pliers). The potato is labelled “unknown”.
One of the photos in the dataset and the objects the program recognises in it, each with its label (in Italian). The potato, quite rightly, is “unknown”.

MICO-100, image recognition with unknown classes

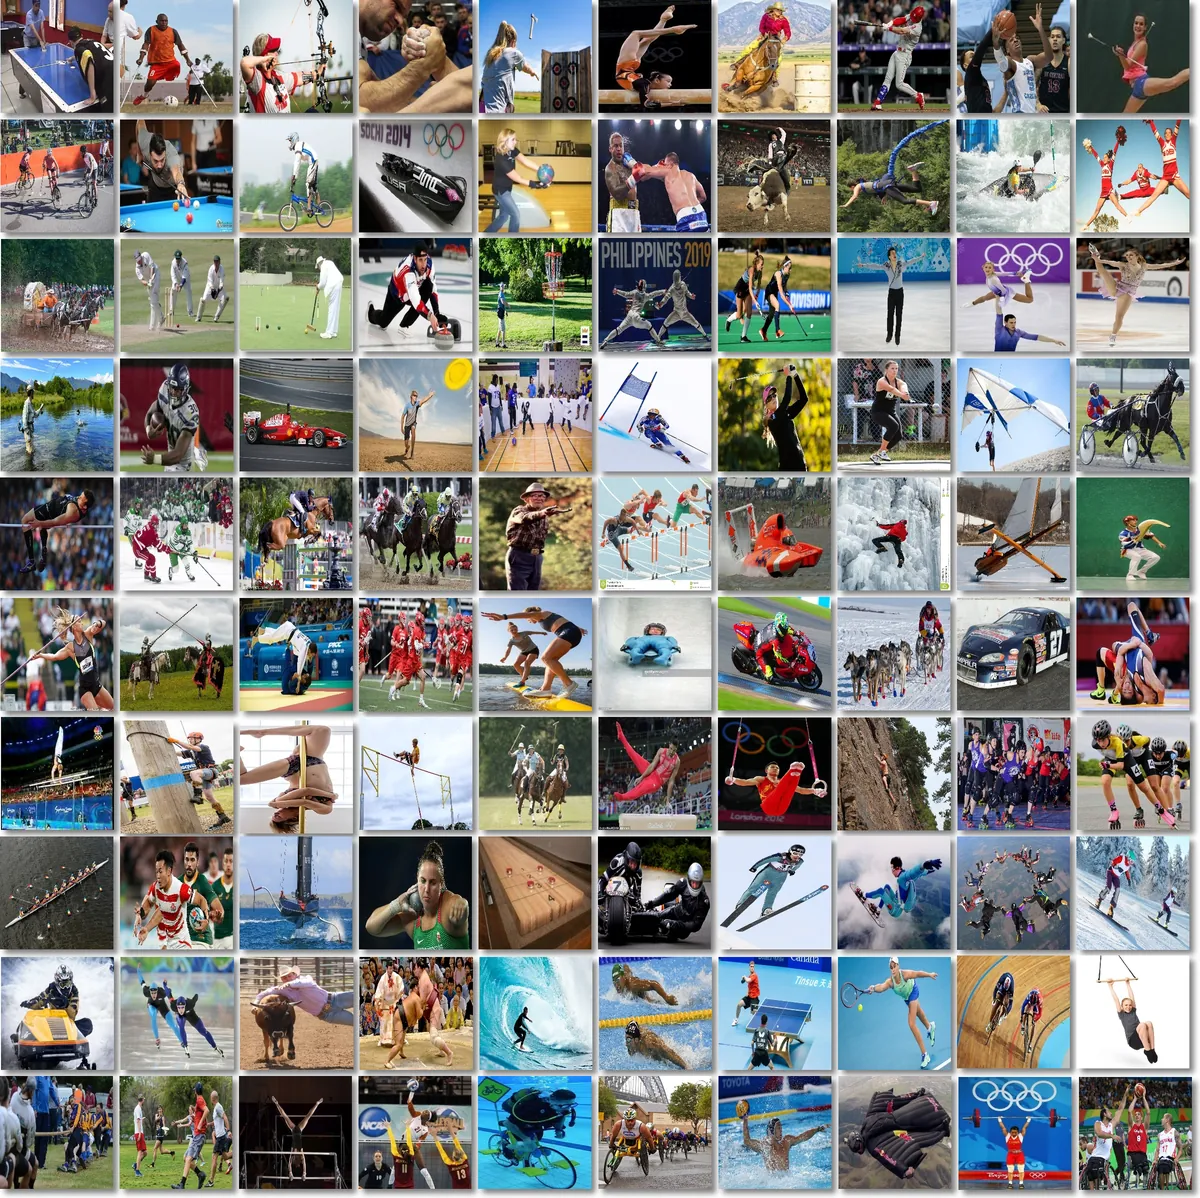
The task was to recognise a hundred sports from photographs and, at the same time, to admit not knowing when the image belongs to none of the known classes. I started from a pre-trained network (SE-ResNeXt-50) and trained it showing it foreign examples too, so that it would learn not to be confident about what it does not know; I set the “unknown” threshold on the validation set, accepting 1% false alarms.

A mosaic of a hundred small sports photographs, ten per row: among them air hockey, archery, arm wrestling, bobsleigh, boxing, curling, fencing, figure skating, motor racing, ski jumping and weightlifting.
One image for each of the hundred classes in the dataset, each a different sport. The photographs are the dataset’s own.

Image orientation classification with transfer learning

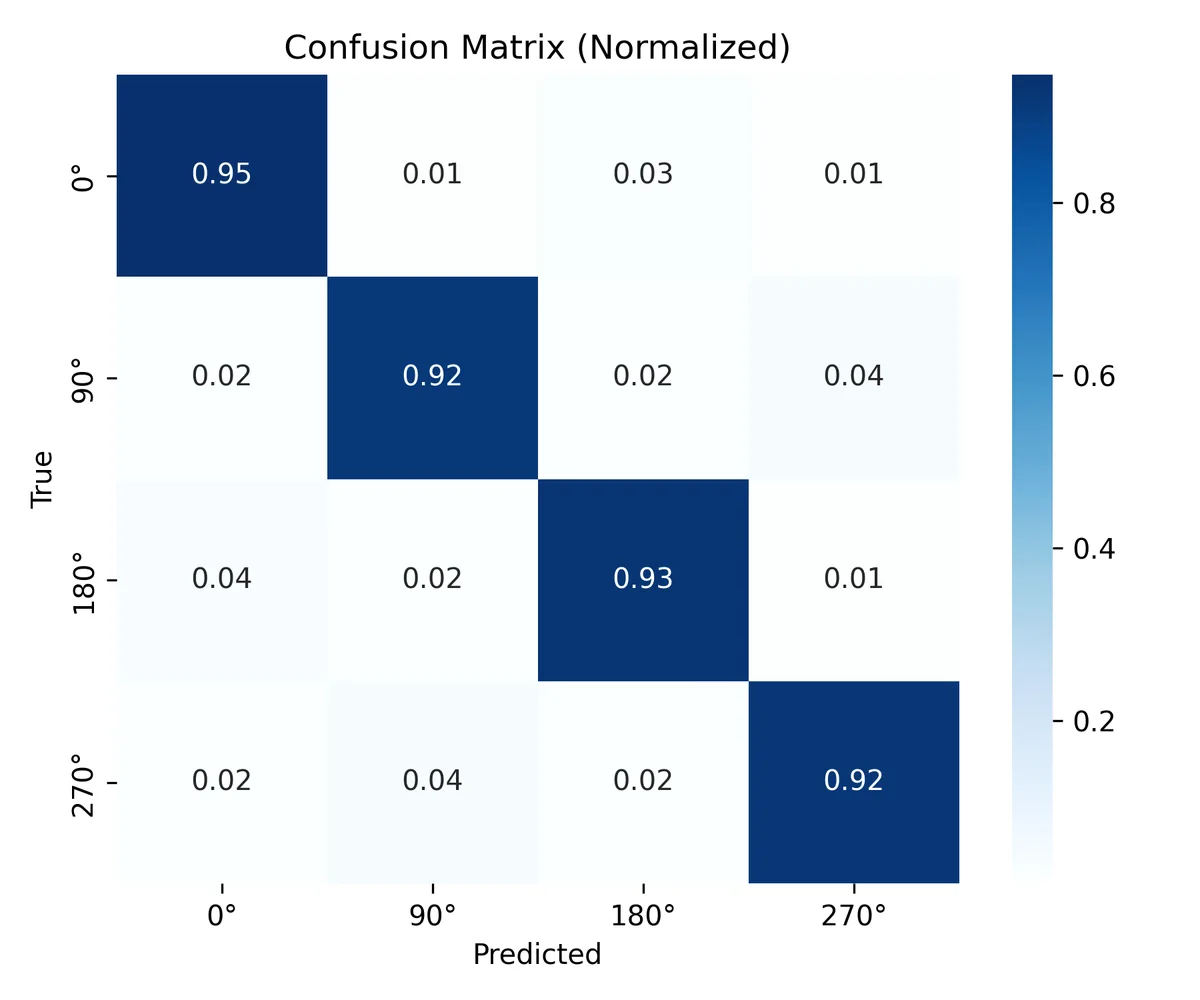
It’s a classifier that tells whether a photo is upright or rotated by 90, 180 or 270 degrees. I started from a light pre-trained network (MobileNetV3 Small) and adapted it in two phases, first only the head and then the last blocks of the network as well, with a fixed seed so that every experiment can be repeated. In its best configuration it reaches 93.1% on the test set; the remaining errors are mostly between opposite orientations. 

Normalised confusion matrix for the four orientations: 0.95, 0.92, 0.93 and 0.92 on the diagonal.
The confusion matrix on the test set: correctly classified photos are on the diagonal.

Dull-Noise, training noise and robustness of a convolutional network

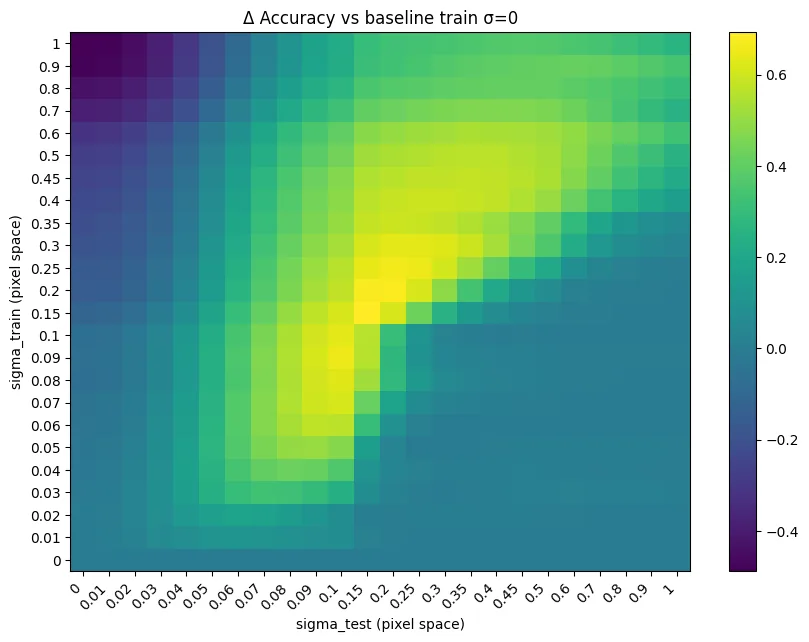
I wanted to know whether adding noise to the training images makes a convolutional network more robust. I trained a ResNet on CIFAR-10 with increasing noise levels and tried every model on clean and degraded data, measuring not only accuracy but also how reliable the output probabilities are. The answer is that noise doesn’t improve generalisation across the board, but it does make the network more robust, and its probabilities more reliable, when the data is degraded.

Heatmap of the change in accuracy compared with the network trained without noise, for every combination of training noise and test noise: a bright diagonal band marks the largest gains.
How much each model gains, or loses, compared with the one trained without noise, as training and test noise vary.

Network analysis of the characters of Game of Thrones

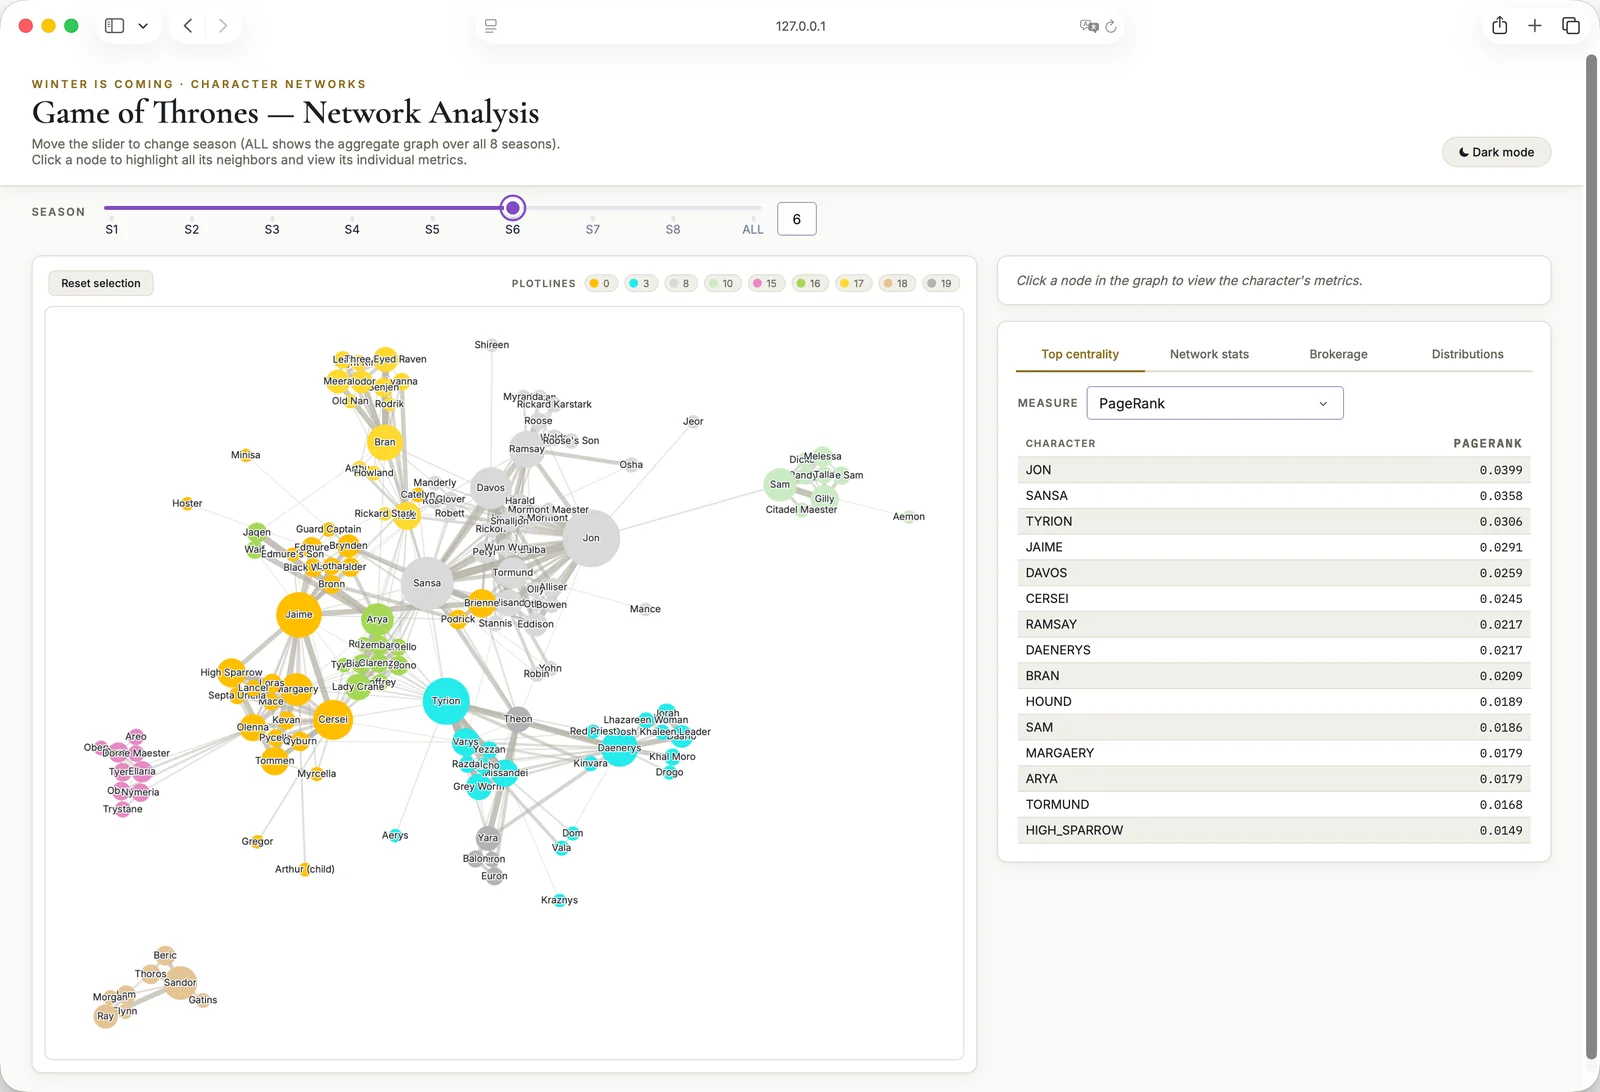
It’s a network analysis project: characters are the nodes, on-screen co-occurrences the edges, with one weighted graph for each of the eight seasons. There were three questions: who really matters in the narrative, what the plotlines are and how they evolve over the seasons, and who holds them together. I used centrality measures, compared three community detection algorithms and followed the plotlines from one season to the next, with a sensitivity analysis to see how much the results depend on the parameters. It all ended up in an interactive dashboard. 

Screenshot of the dashboard: a slider to pick the season, the character graph coloured by plotline and, on the right, the ranking of characters by PageRank.
The dashboard on season six: colours are plotlines, and the table ranks the characters by PageRank.

F1nder, answer retrieval from historical newspapers (1800-1920)

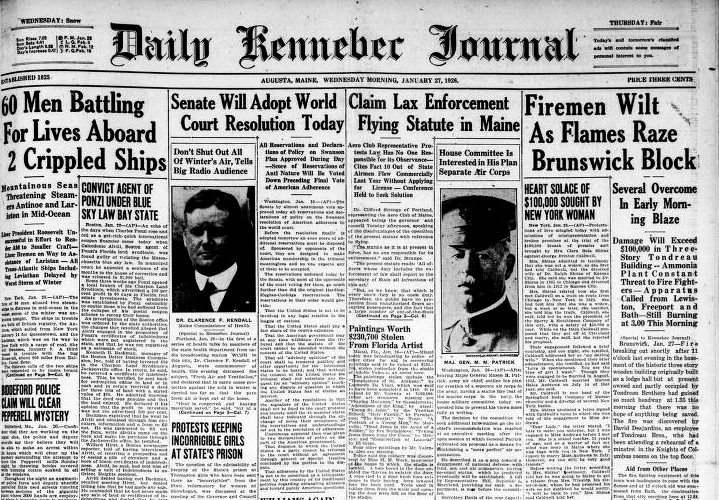
F1nder is a search engine that answers questions about nineteenth-century events by searching the newspapers of the time: almost 40,000 digitised pages, with error-ridden OCR.  We compared four classical models, four neural bi-encoders and a BM25F that also weighs the entities recognised in the text (people, places, organisations). The last one is the best: MAP 0.73, and 86% of the time the right page is in the top ten. On top of it we built a small RAG pipeline with a local model (Gemma 3), and we double-checked its automatic evaluations by hand.

The top half of the front page of the Daily Kennebec Journal of Augusta, Maine, 27 January 1926: the masthead in blackletter and, below it, headlines and dense columns of text, with two portraits.
A period American front page, from the project slides: the Daily Kennebec Journal of 27 January 1926. The pages F1nder searches look like this one, and come from the Chronicling America collection.

A home-made DCT2 and JPEG-style compression

I wrote the two-dimensional discrete cosine transform (DCT2) by hand, in two versions, and compared it with SciPy’s, which relies on the FFT: blocks from 8 to 8192, 32 repetitions for each size, mean and standard deviation of the timings. Then I wrote a small JPEG-style compressor with a graphical interface: you pick a greyscale image, the block size and how many frequencies to keep, and see the original and the compressed version side by side.

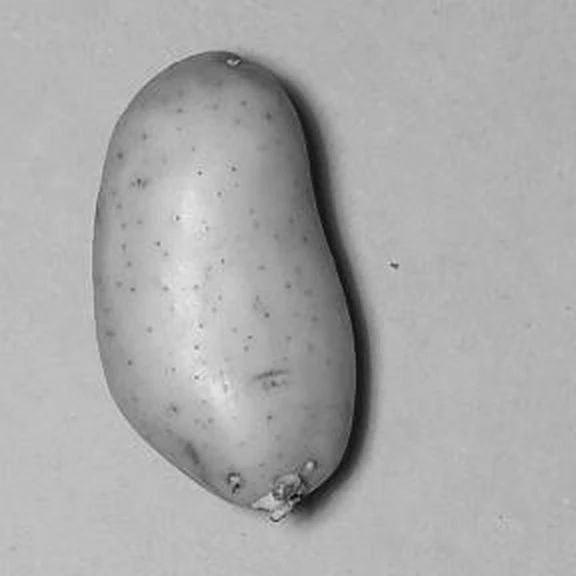
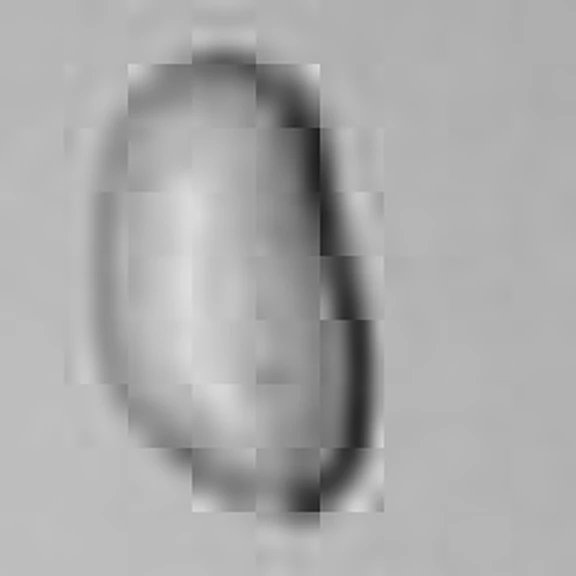
Greyscale detail of a photo: a potato on a light surface, sharp, with its speckled skin.The same potato after compression: the shape is still recognisable, but it is blurred, the skin is smooth and the edges of the square blocks show.
A detail of one of my own photos (the potato from BIMINU) before and after the compressor: of each 32×32-pixel block, only the 10 lowest frequencies out of 1,024 are kept.

The Gnomes of Vezio, a 3D stealth video game

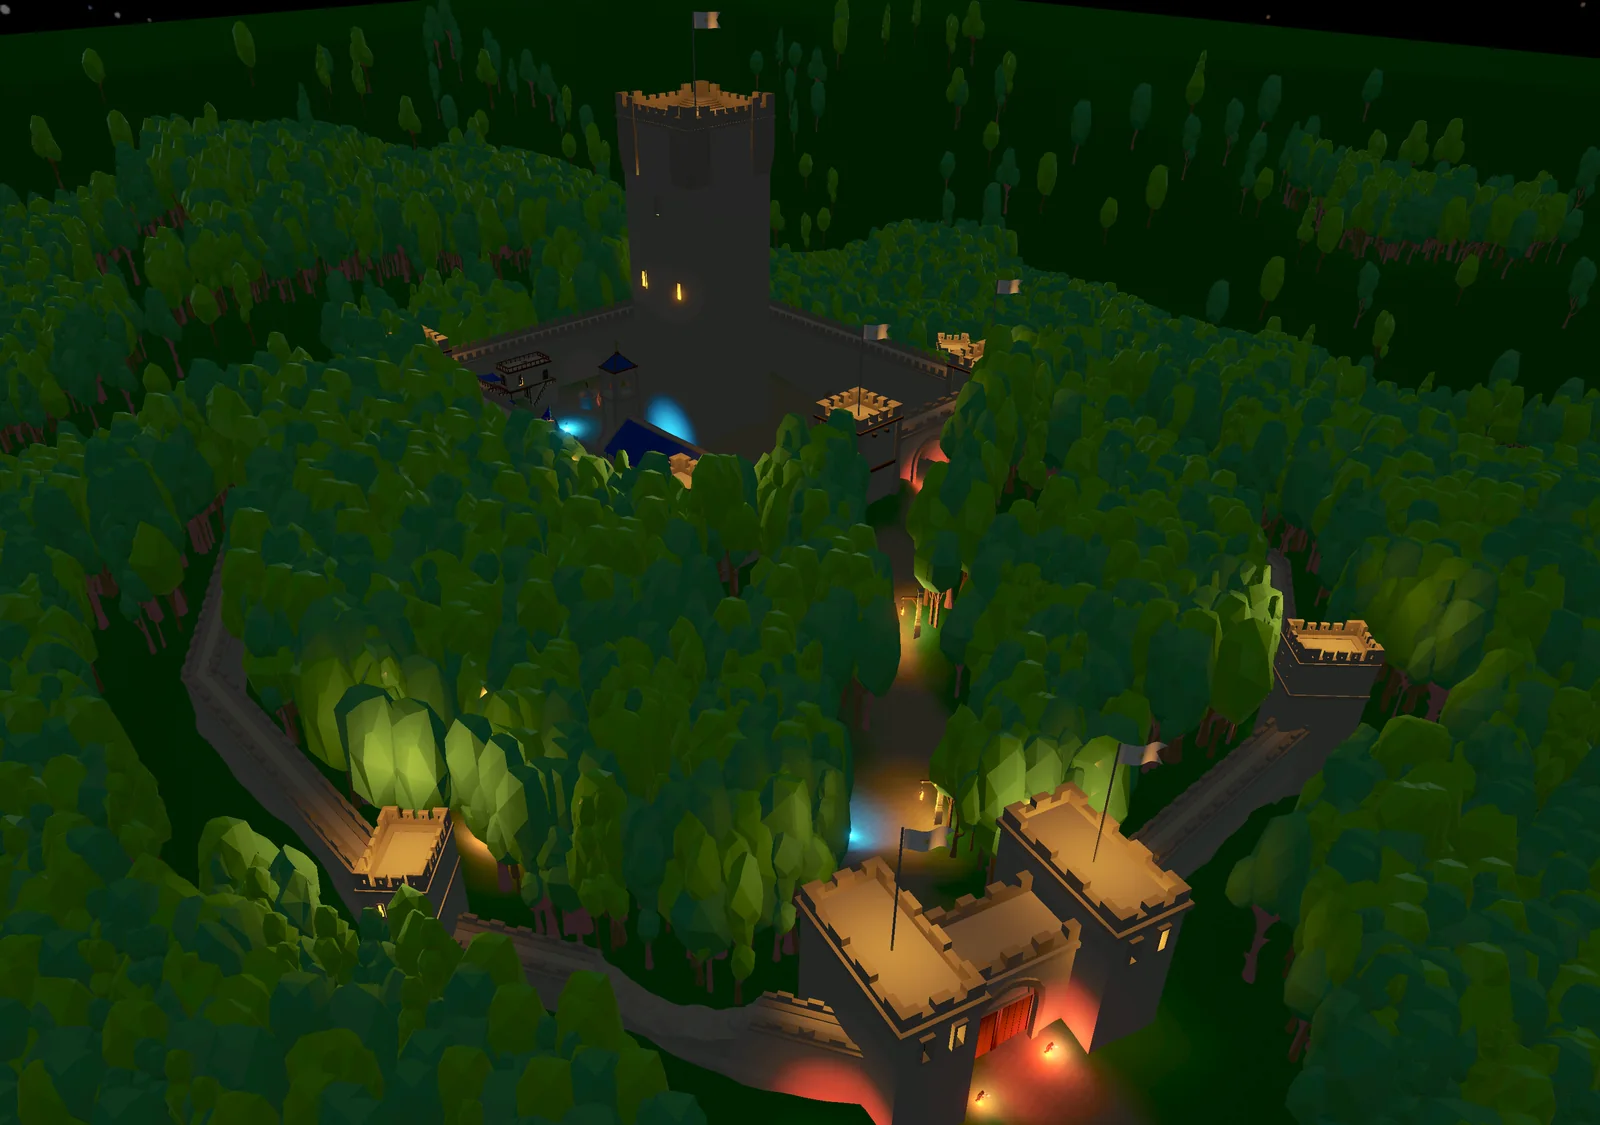
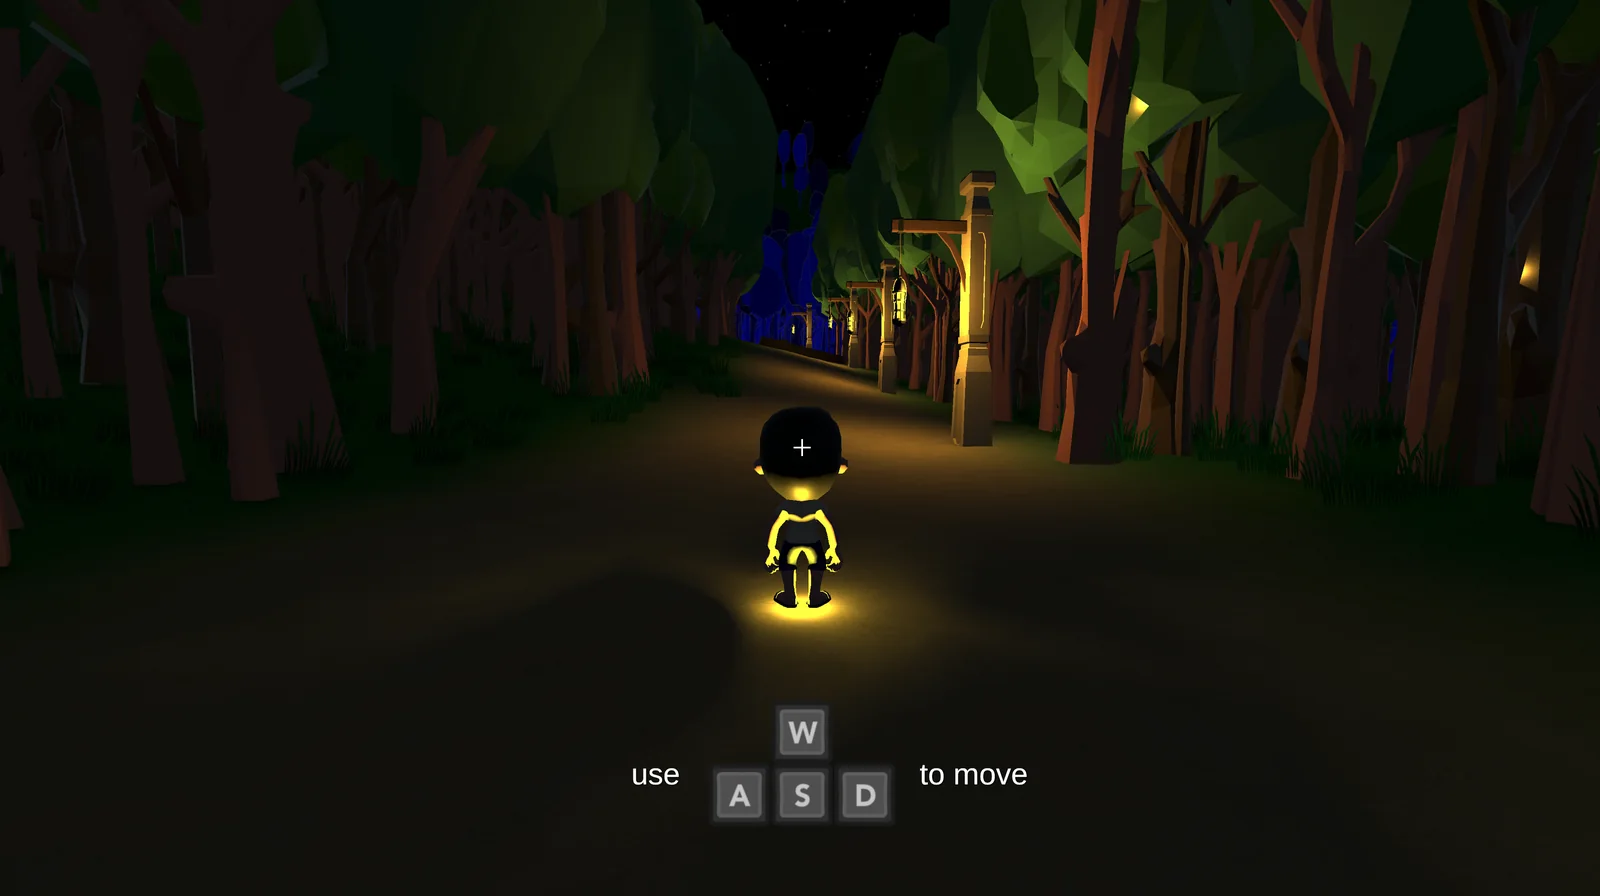
It’s a low-poly 3D stealth game that I made in Unity for the Game Design course. You have to rescue the five gnomes by sneaking into the castle and slipping past the guards, who can chase you and talk to one another. The castle is modelled on the real Vezio Castle (opens in a new tab), on Lake Como. 

The castle of the game seen from above, at night: a crenellated tower on top of the hill, walls running down through the wood to a gatehouse with a red door, and coloured lights along the path.Screenshot of the game: a boy seen from behind on a path through a night-time wood lit by lanterns, with a prompt showing the W, A, S and D keys to move.
Above, the castle of the game seen from the air; below, the start of the game, on the path through the wood.

Analysis and portfolios on six S&P 500 stocks

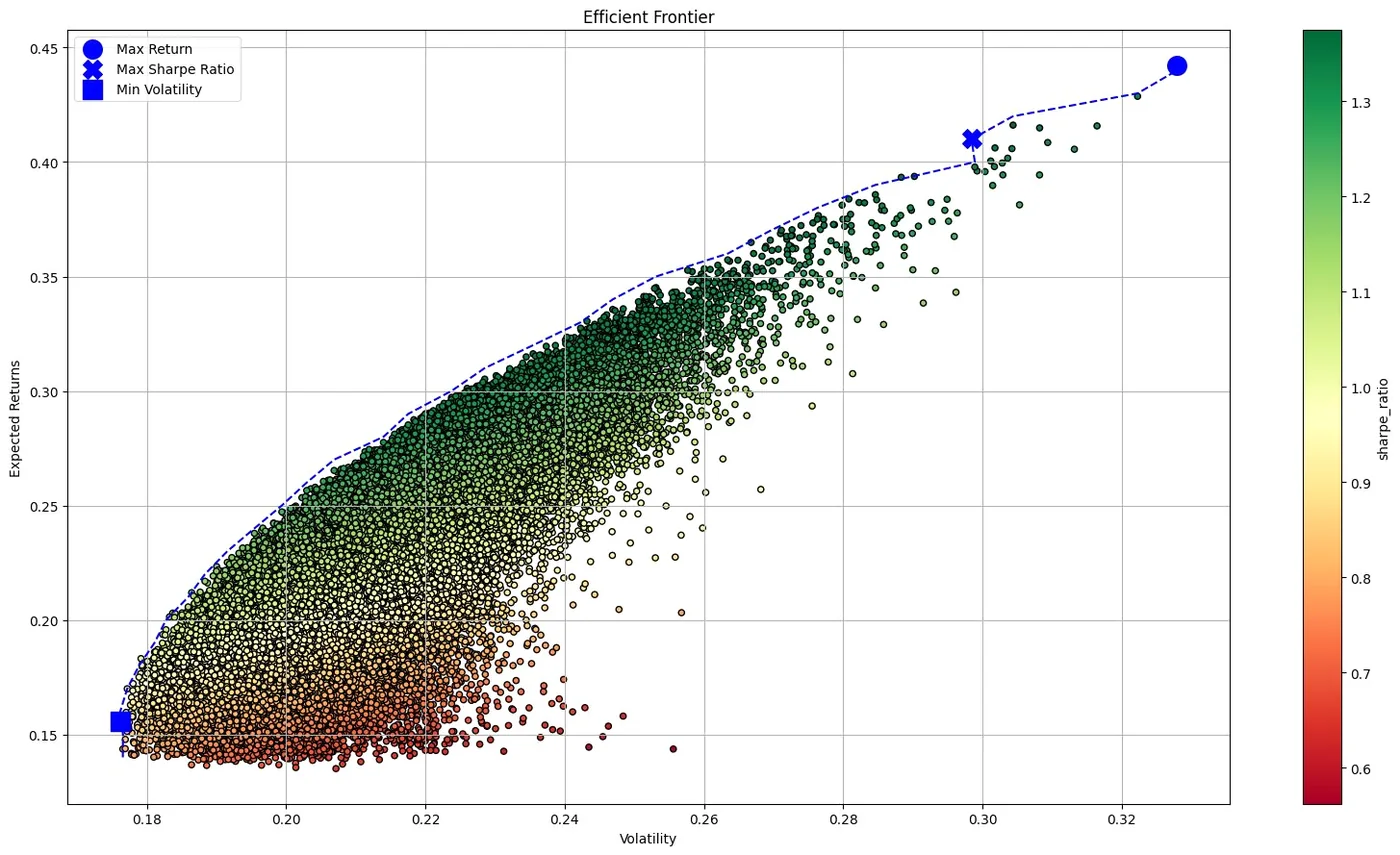
I compared eleven years of prices of six American stocks with the S&P 500. I described the returns, tried to forecast them with a seasonal model (SARIMAX), compared moving-average trading strategies with plain buy and hold, which wins in the long run, and built the efficient frontier with a Monte Carlo simulation of 100,000 portfolios. 

Scatter plot with volatility on the horizontal axis and expected return on the vertical one, coloured by Sharpe ratio; a dashed line follows its upper edge and three markers show the portfolios with maximum return, maximum Sharpe ratio and minimum volatility.
The portfolios of the Monte Carlo simulation: the upper-left edge is the efficient frontier.

Recommender system on e-commerce ratings

It’s a recommender system built on the ratings of the users of a clothing e-commerce site, with a very sparse user-item matrix. I compared two collaborative filtering approaches, one based on the similarity between users and one on matrix factorisation, chosen and checked with cross-validation; with the models I completed the matrix, segmented the users into groups and produced the recommendations for each.

URI parser in Common Lisp and in Prolog

It’s a URI parser that the two of us wrote twice, in Common Lisp and in Prolog. It reads the string one character at a time, like a state machine, and extracts scheme, host, port, path and the rest according to a simplified version of the standard, with the exceptions of mailto, news, tel and IBM mainframe datasets. The assignment forbade shortcuts such as finding the colon and slicing the string; the Prolog version also works backwards, with a partially known result.

Back to the start