Before code there was wood
At secondary school I studied craft and industrial woodworking, furniture drawing (interior design) and interior finishes (product design). I discovered my passion for computer science later.
I do AI and ML engineering. I work in Python, mostly on LLMs, computer vision and data pipelines.
I finished my MSc in Computer Science at the University of Milano-Bicocca (opens in a new tab) in October 2026, with full marks (110 out of 110). And to think that at school I studied woodworking. From wood to LLMs, I’ve come a long way: follow the timeline to see the whole journey.

If you only have a minute: my CV, very condensed, in four points.
At secondary school I studied craft and industrial woodworking, furniture drawing (interior design) and interior finishes (product design). I discovered my passion for computer science later.
2019to 2021
Before university I spent a year learning to build applications. The theory came later.
After secondary school I signed up for this one-year technical course in full-stack development (an IFTS, in the Italian system) at ITS Angelo Rizzoli (opens in a new tab) in Milan. I came from woodworking, and here I discovered a world: computer science. For a year I built applications, in Java, for Android and for the web, and I fell in love with that world.
That’s why, when the course ended, I chose to enrol at university.
In September 2020 I enrolled in Computer Science at the University of Milano-Bicocca (opens in a new tab). From the start, besides attending my courses, I also took on a couple of extracurricular activities. The first was iBicocca (opens in a new tab) Platinum, the university’s programme on innovation and entrepreneurship. The second was a masterclass in digital product design, from UX research to production, where I was an alpha tester.
2021to 2023
In my second year I took on several things at once: a junior enterprise, a magazine, my first students.
I proposed it, so then I had to make it work
JEMIB (opens in a new tab) is Bicocca’s junior enterprise (opens in a new tab), a consulting association run by students. It had no IT & Business Intelligence unit, so I proposed setting one up: I founded it and then led it. I defined what it would cover, picked and trained the people and carried the first projects through to the handover, working closely with the board during both terms.
The first big project was the internal business software, the one JEMIB uses to manage its own processes and keep track of how its people are deployed. I designed its data and software architecture, built the full-stack side, from the database to the interface, and turned the association’s needs into specifications we could verify. For the data we used Python and SQL, and for the other units we built business intelligence dashboards and indicators.
For a few months I wrote for iWrite (opens in a new tab), the online magazine of iBicocca (opens in a new tab). They were articles on technology and business for people outside the field: I picked the topic, read up on primary sources, and then there was an editorial line and deadlines to keep to.
For three years I tutored computer science students and helped them with their exam projects, from the first outline to delivery, mostly in Python, SQL and Java. You always start again from the exact point where the student got stuck, and I spent a lot of time reading other people’s code to find the bugs.
Meanwhile the first course projects were coming in: a URI parser written twice (in Common Lisp and in Prolog), an analysis of eleven years of prices for six S&P 500 stocks (in Python, with pandas and statsmodels), a recommender system (in Python, with Surprise). You’ll find them in the portfolio.
2023to 2025
This is where computer vision comes in. First an exam project with no neural networks, then my bachelor’s thesis on autonomous driving and, once on the master’s, a robot that has to map a home by itself.
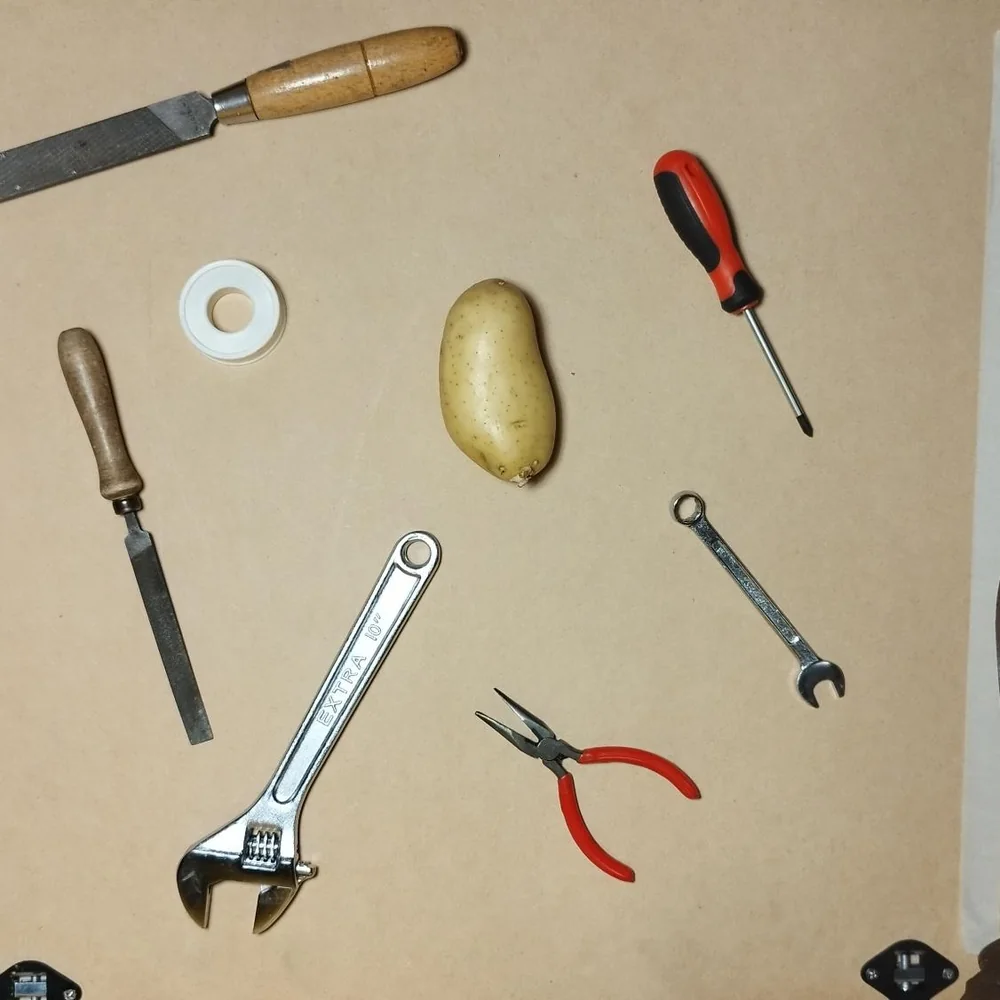
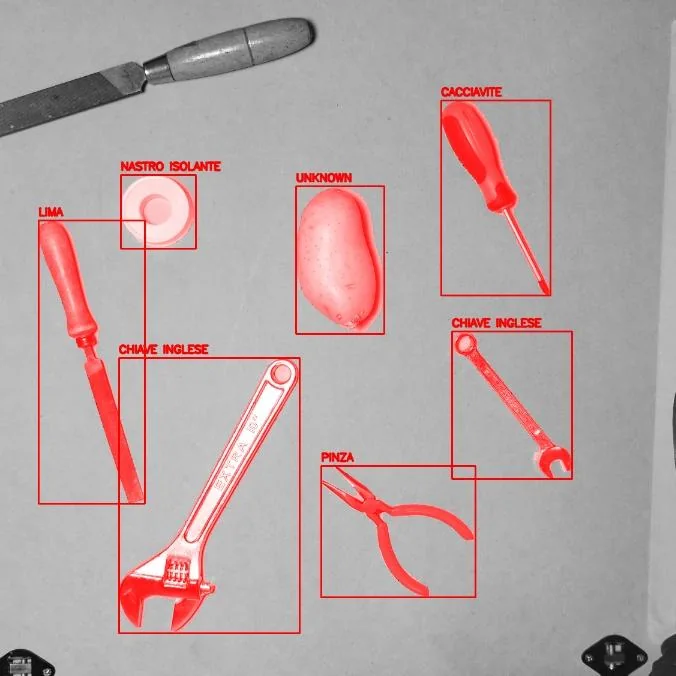
One of the unknown objects was a potato
This was the project for the Image Processing course, and it simulated an industrial process: recognising the tools lying on a work surface, with different backgrounds and lighting, and flagging as unknown anything that fits no category. The brief asked for two more things: no neural networks, because the point was to learn to master image processing itself, and a dataset built from scratch. So I photographed the tools myself, and in the end the mean accuracy was 0.99.
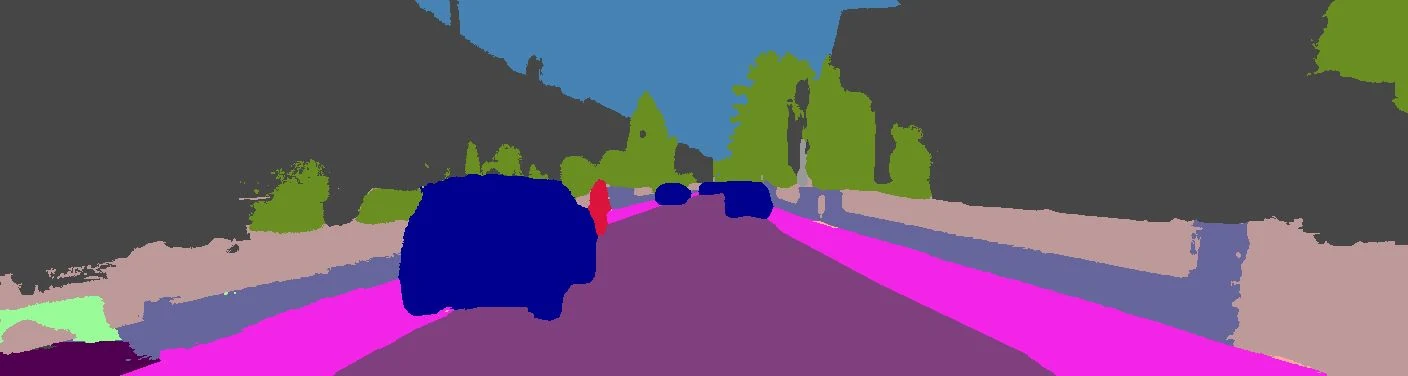
Multi-instance, that is panoptic: it doesn’t just say “this is a car”, it says which one. Two cars side by side stay two cars
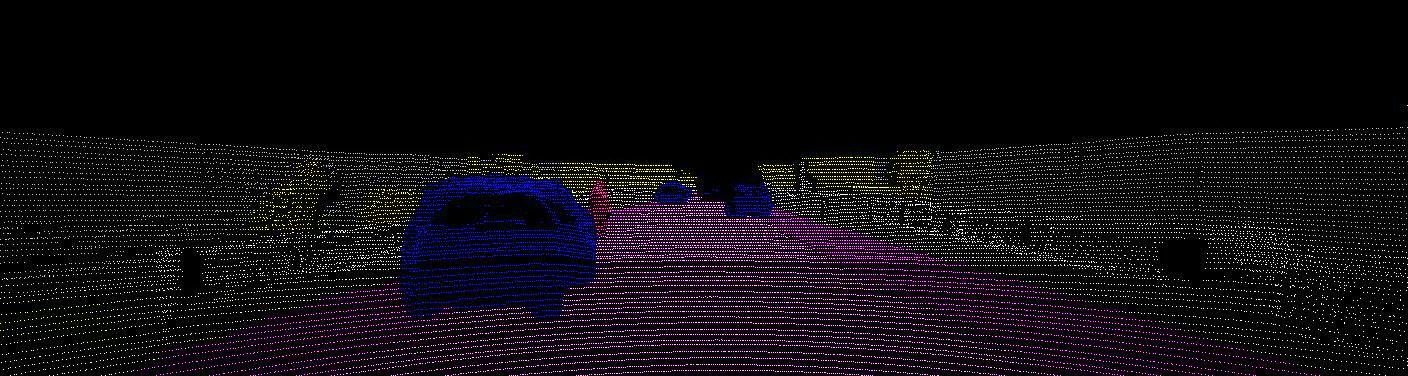
The thesis is titled “Multi-instance semantic segmentation of point clouds” and I did it at IRALAB (opens in a new tab), Bicocca’s robotics lab. In a self-driving car the camera sees what is in the scene, but on a flat image; the LiDAR measures where everything is in space, but returns points with no meaning. I brought the two together: panoptic segmentation (which says, pixel by pixel, what is there and tells one object from another) is run on the camera images and then back-projected onto the LiDAR point cloud, so that every point knows what it is: road, car, pedestrian.
I designed the pipeline and wrote it in Python: it projects the cloud onto the image plane using the calibration matrices of the two sensors, runs a pre-trained network (EfficientPS) on the image, gives every point the label of the pixel it lands on and removes the dynamic objects, which would disturb the SLAM system the result is meant for, the one a vehicle uses to build a map and work out where it is. Everything runs in a reproducible Docker environment, on the lab’s GPU cluster.
In July 2024 I got my bachelor’s degree, with full marks (110 out of 110).
He’s called Jesse after Jesse James: reinforcement learning has its “bandits”
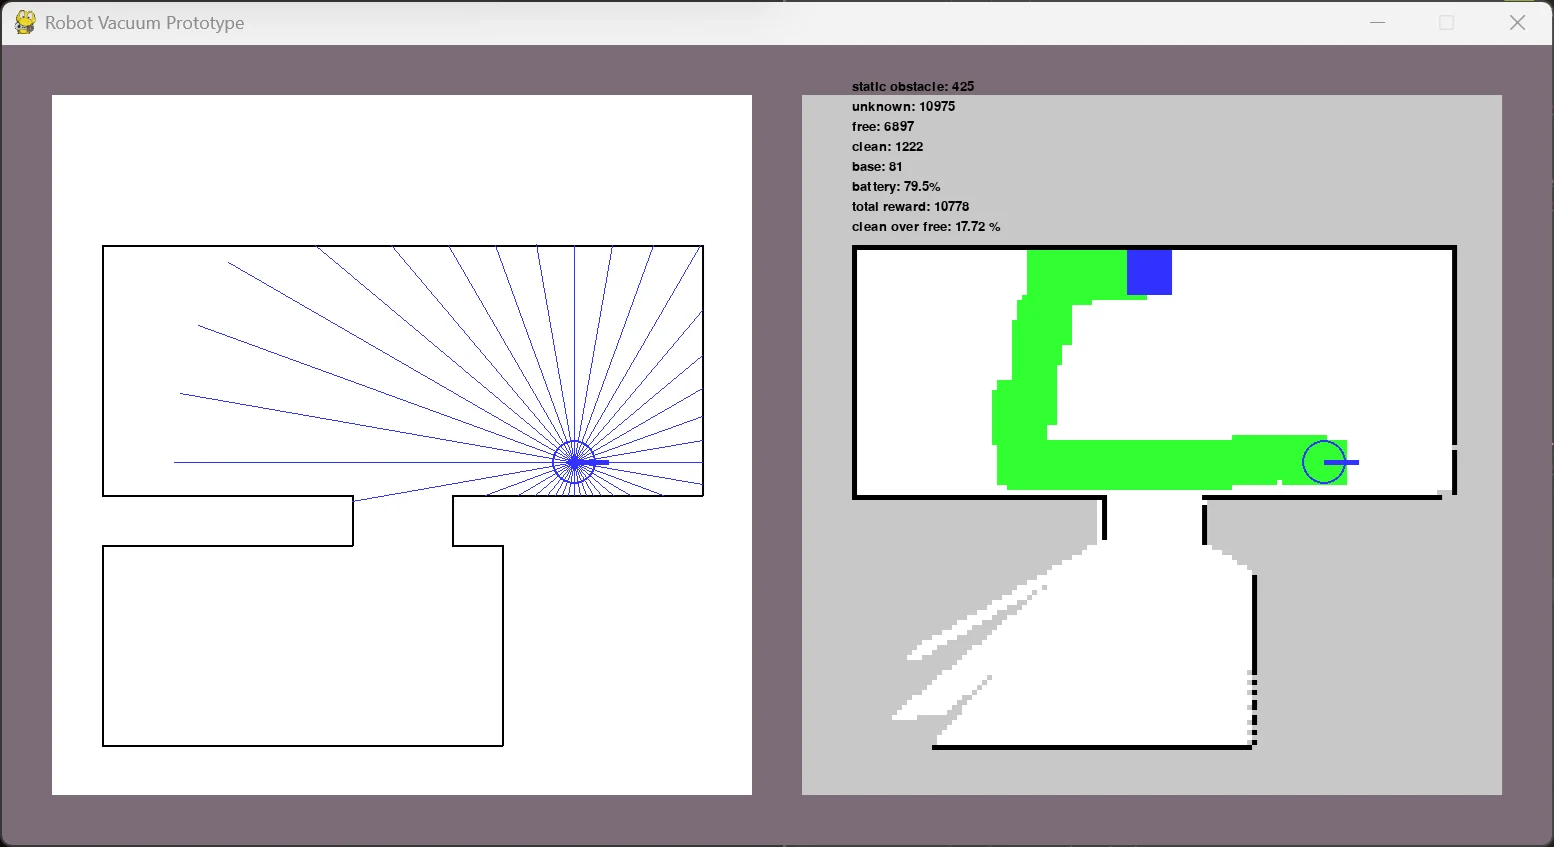
Jesse is a robot vacuum cleaner that lives in a simulation. It has to build a map of the room while it cleans, avoid obstacles, keep an eye on its battery and get back to its base before it runs out. I wrote the simulation in Python (the continuous environment, its discrete abstraction, the simulated LiDAR sensors) and two agents that learn by trial and error, rewarded when they get it right (that’s reinforcement learning): one with Q-learning and one with PPO. The version that works best keeps its inputs separate, with one encoder for the map, one for the LiDAR and one for the scalar quantities. I trained it with reward shaping and curriculum learning, all on my laptop’s CPU.
2024to 2026
For my master’s I moved on to language models, and ended up spending most of my time on how to measure them.
While working on my thesis, I contributed with the MIND (opens in a new tab) lab to two papers on the safety of Italian language models, presented at CLiC-it 2025 (opens in a new tab), the Italian conference on computational linguistics.
86% of the time, the right page is in the top ten.
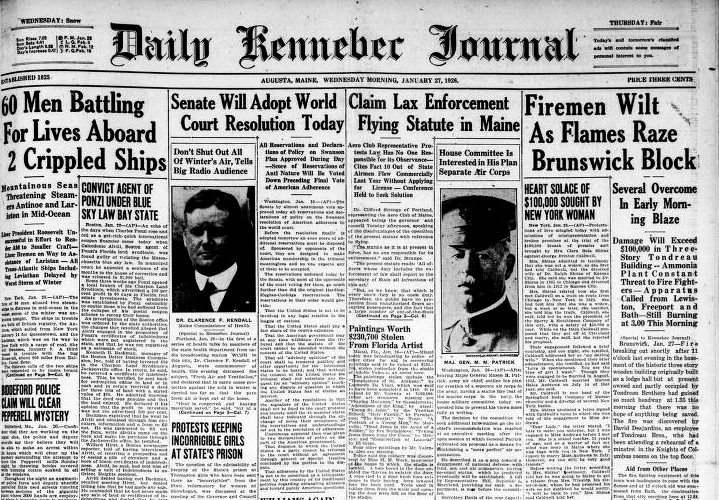
Three of us built it for the Information Retrieval course. F1nder is a search engine that answers questions about nineteenth-century events by looking through the newspapers of the time: almost 40,000 digitised pages, with error-ridden OCR. We compared classical, word-based retrieval models with neural ones, and the best turned out to be a BM25F that weighs, alongside the text, the entities it recognises: people, places, organisations. It beats every baseline and leaves the neural bi-encoders, which struggle on text this noisy, far behind. On top of it we built a small RAG pipeline, in which a language model running locally answers from the pages retrieved, and we double-checked its automatic evaluations by hand.
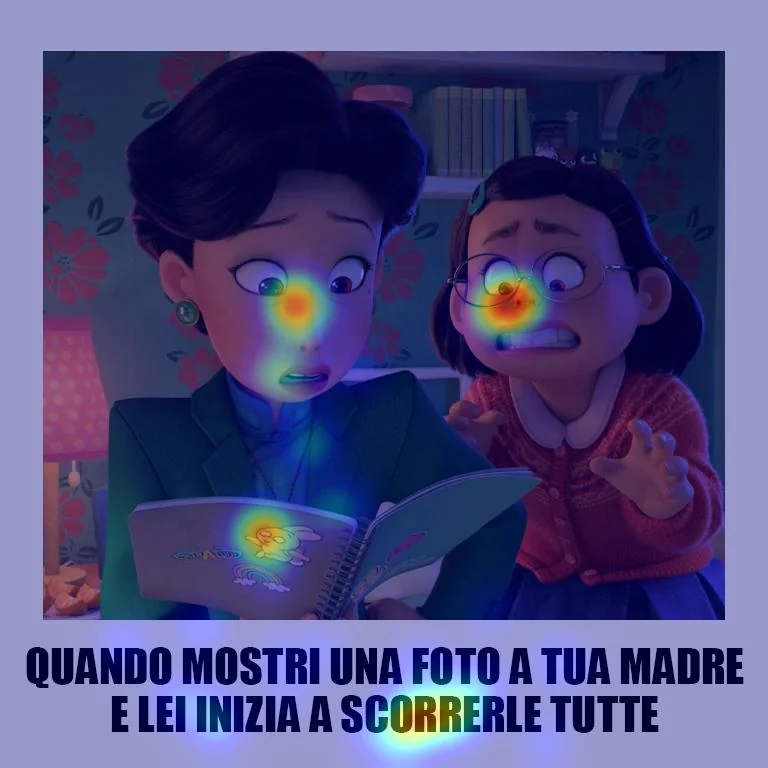
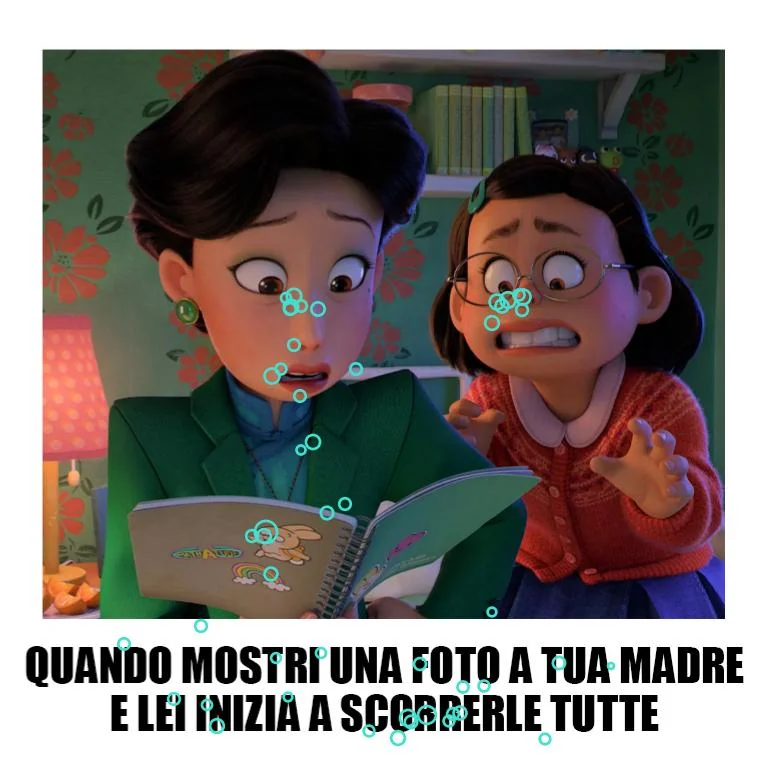
In 2026 I worked on “Collection and Analysis of Human Attention Maps on Multimodal Content”, a research project that brings together the MIND (opens in a new tab) lab, the MMSP (opens in a new tab) (MultiMedia Signal Processing) lab and the university’s Department of Psychology (opens in a new tab). The project shows people memes, taken from datasets already validated for the automatic detection of online misogyny such as MAMI (opens in a new tab), and records where they look and how they react physiologically while they judge them. I rebuilt the experimental protocol for collecting the participants’ data, with an eye tracker, Shimmer sensors for heart rate (PPG) and skin conductance (GSR) and Qualtrics questionnaires: the aim is to use that data as ground truth, that is as the reference, for the outputs of two neural models. Then I analysed it in Python, down to attention heatmaps for each meme and each group.
Eight seasons, eight graphs
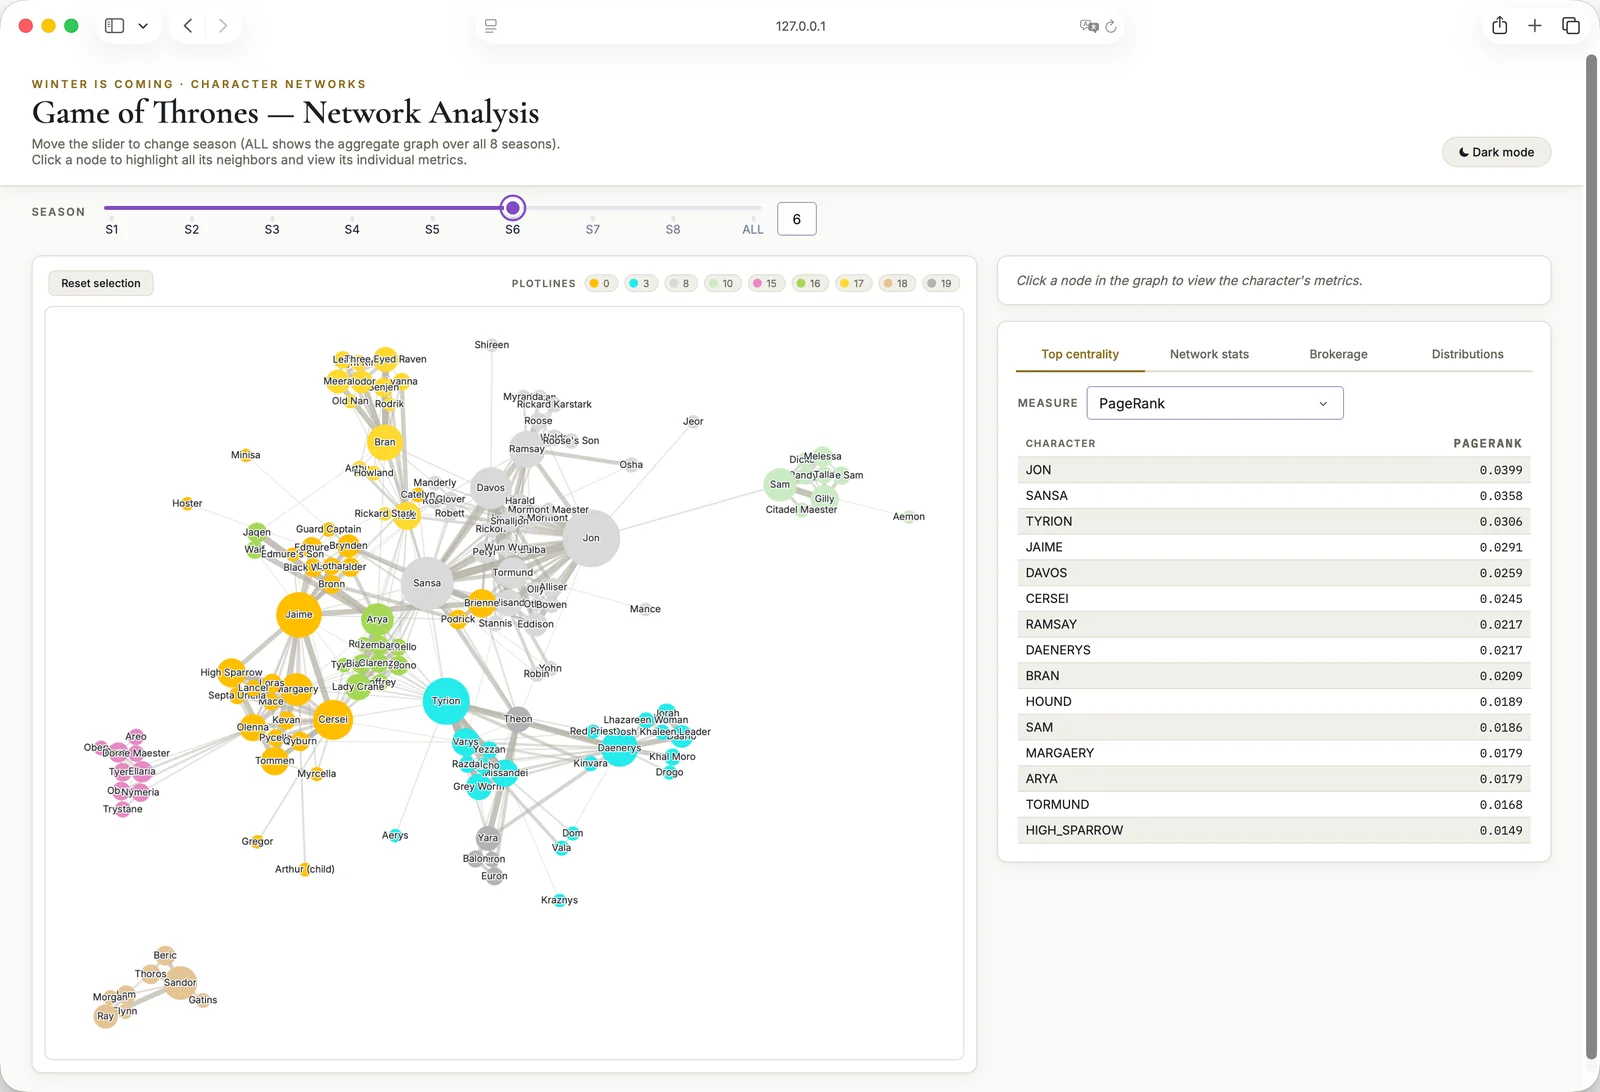
For the Data Analytics course I turned Game of Thrones into a network: the characters are the nodes, the scenes they share are the edges, and there is one graph for each of the eight seasons. There were three questions: who really matters in the story, what the plotlines are and how they evolve over the seasons, and who holds them together. I used centrality measures, compared three algorithms that find communities (the groups of characters that mostly appear together) and followed the plotlines from one season to the next. It all ended up in an interactive dashboard.
I like history outside work too. Here I had a good excuse.
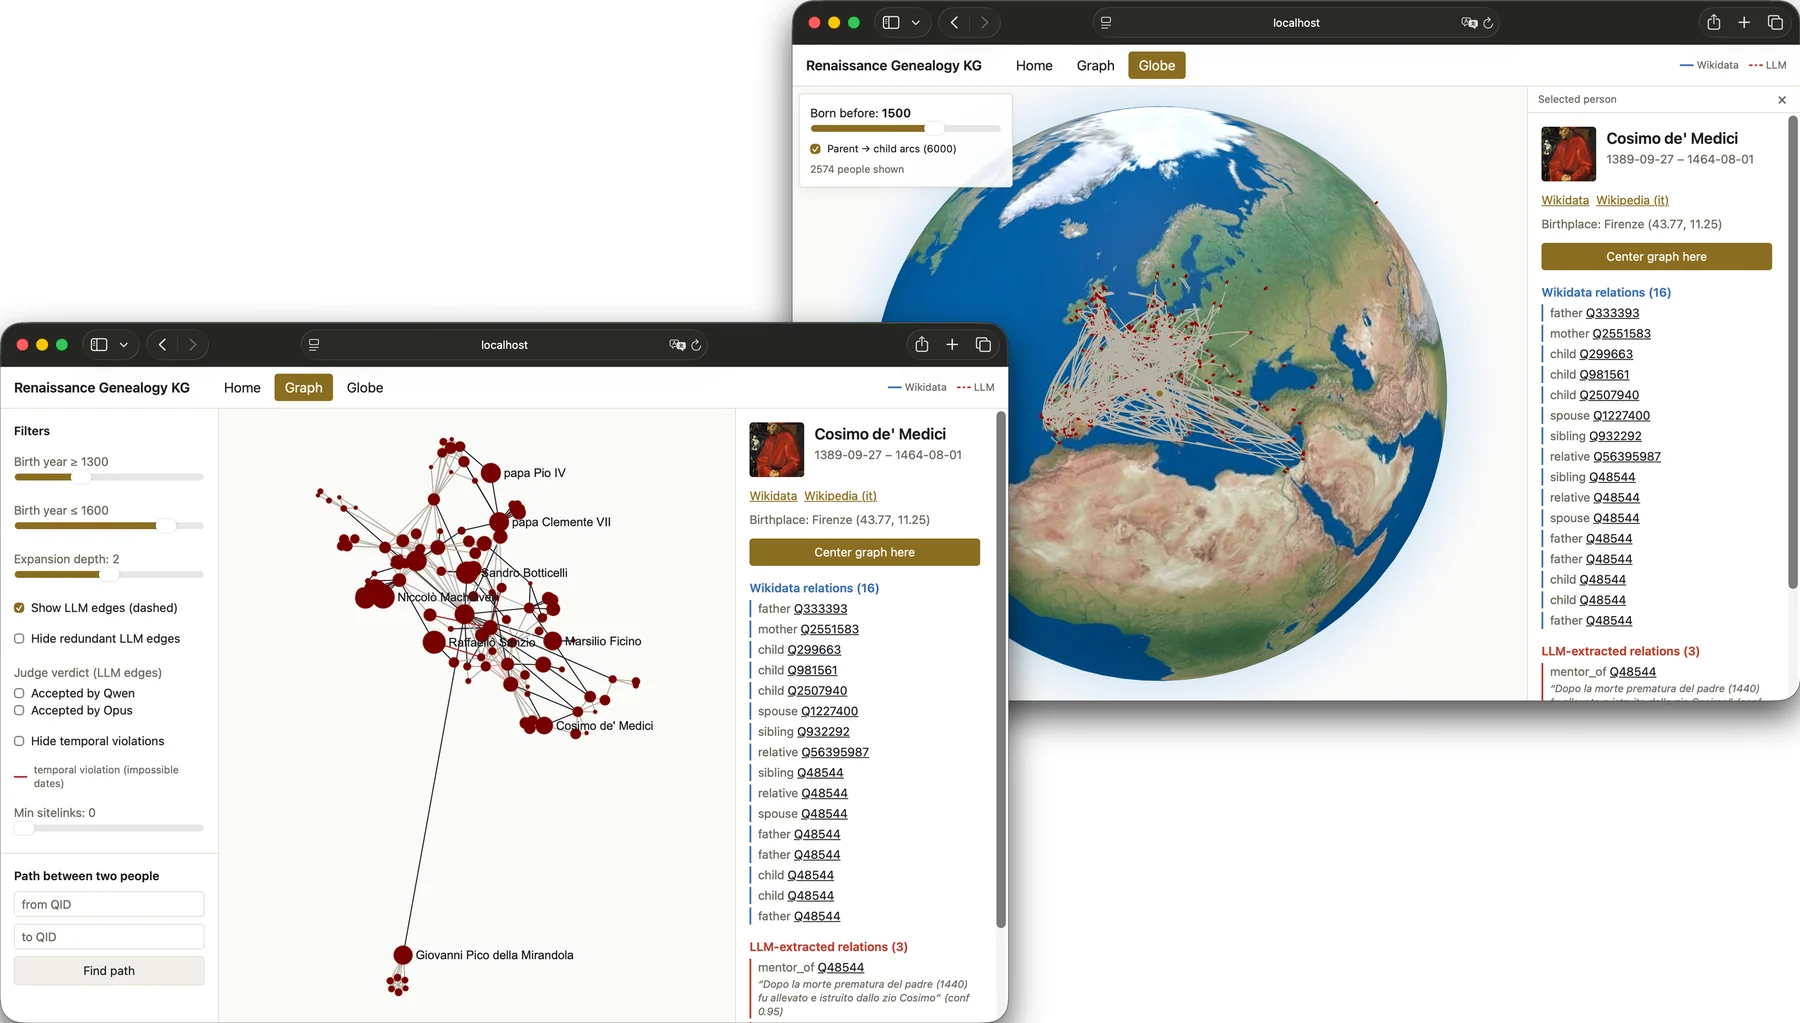
It’s a knowledge graph of the family tree of the great Renaissance families, rebuilt from Wikidata: over 12,000 people and 84,000 relations. I wrote a crawler that collects the data from Wikidata and a pipeline that enriches the graph with a local language model: it reads the Wikipedia biographies and extracts the kinships Wikidata is missing, each with the sentence that proves it. The graph can be explored from a web interface, in two ways: as a network of people, or on a globe.
And here the excuse is art
DMC is a project of my own: a knowledge base about art in all its forms, architecture included. The idea is that you can start wherever you like, from an artist, a work, a period or a place, and get to everything else from there. I’m working on it right now, and for the moment there’s nothing I can show.
Meanwhile my master’s courses kept bringing other projects: networks that have to admit they don’t know (in PyTorch), a JPEG-style compressor (in Python, with NumPy and SciPy), even a video game (in Unity). You’ll find them in the portfolio.
On the most permissive model: harmful responses halved, with no loss in helpfulness.
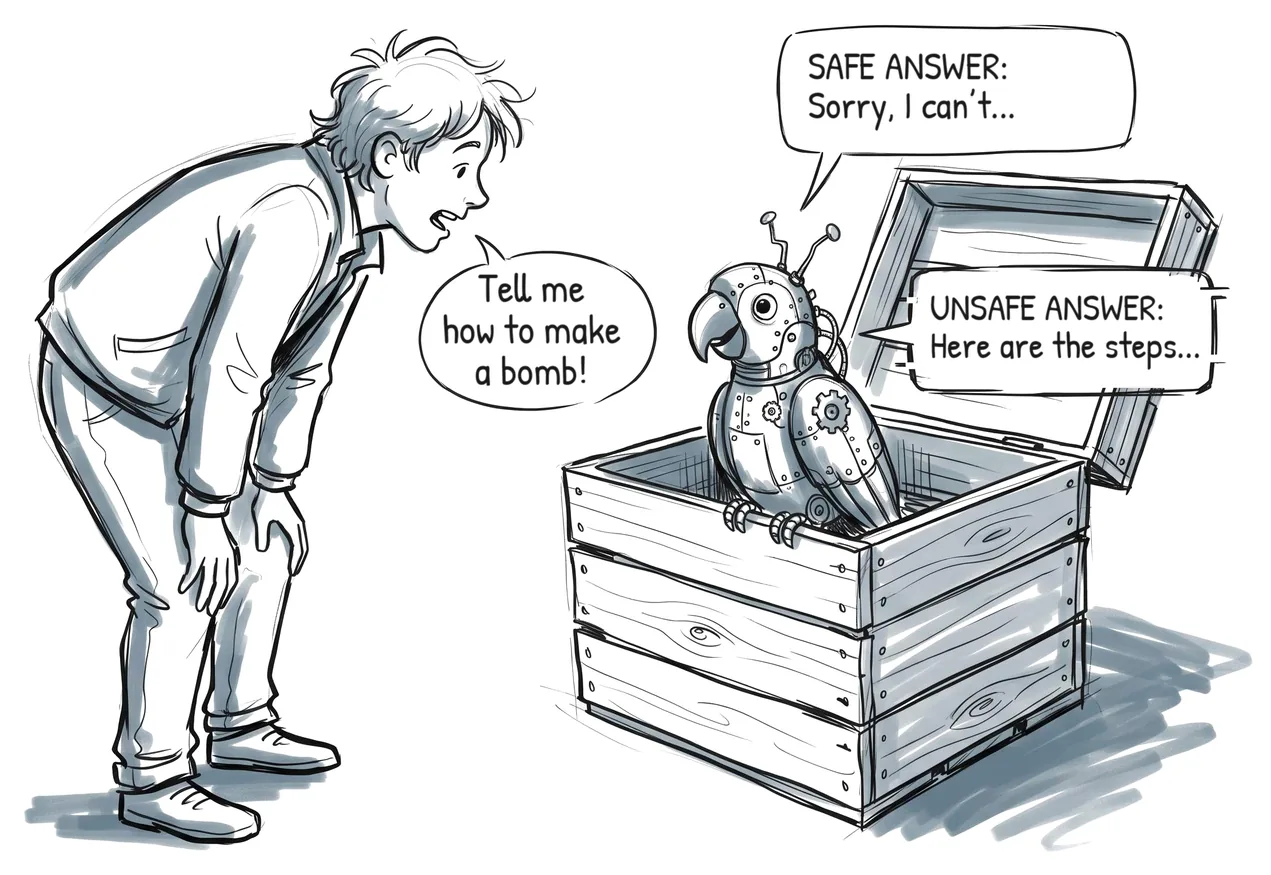
Making an LLM safer is easy: you just teach it to say no. The hard part is doing that without it starting to say no when it shouldn’t. In my thesis, done at the MIND (opens in a new tab) lab, I measured that tug of war: I aligned three open-weight models (Mistral, Llama and Gemma) with DPO and SafeDPO, two techniques that teach a model which of two answers to prefer, and evaluated 33 versions of them on 9 benchmarks. I wrote the pipeline myself in Python, from fine-tuning to analysis, and it runs on the university’s HPC cluster.
In October 2026 I defended my thesis and graduated, with full marks again (110 out of 110).
today
Right now I’m working on DMC, a personal project: a knowledge base about art in all its forms, architecture included.
Machine learning, AI engineering, research, software: it’s the work I enjoy doing, and the more I do it, the more I want to keep going. I like the moment a model learns something, but I like what comes after even more, when you have to measure whether it really works and build code around it that people can trust. I want to keep doing that on LLMs, computer vision and data pipelines, and I can still see a huge amount left to learn.
Working on something I could help with? Or just fancy a chat about any of this? Get in touch, I’d be glad to hear from you.
Italian is my first language, I speak English fluently and use it every day, and I speak a little Spanish.
When I’m not working I read non-fiction and biographies, get lost in history, art and a bit of physics and, whenever I can, go and do a via ferrata or slip into a museum.
Thanks for reading this far